Work
Click on thumbnails for more images, interactive pages, or associated reports.
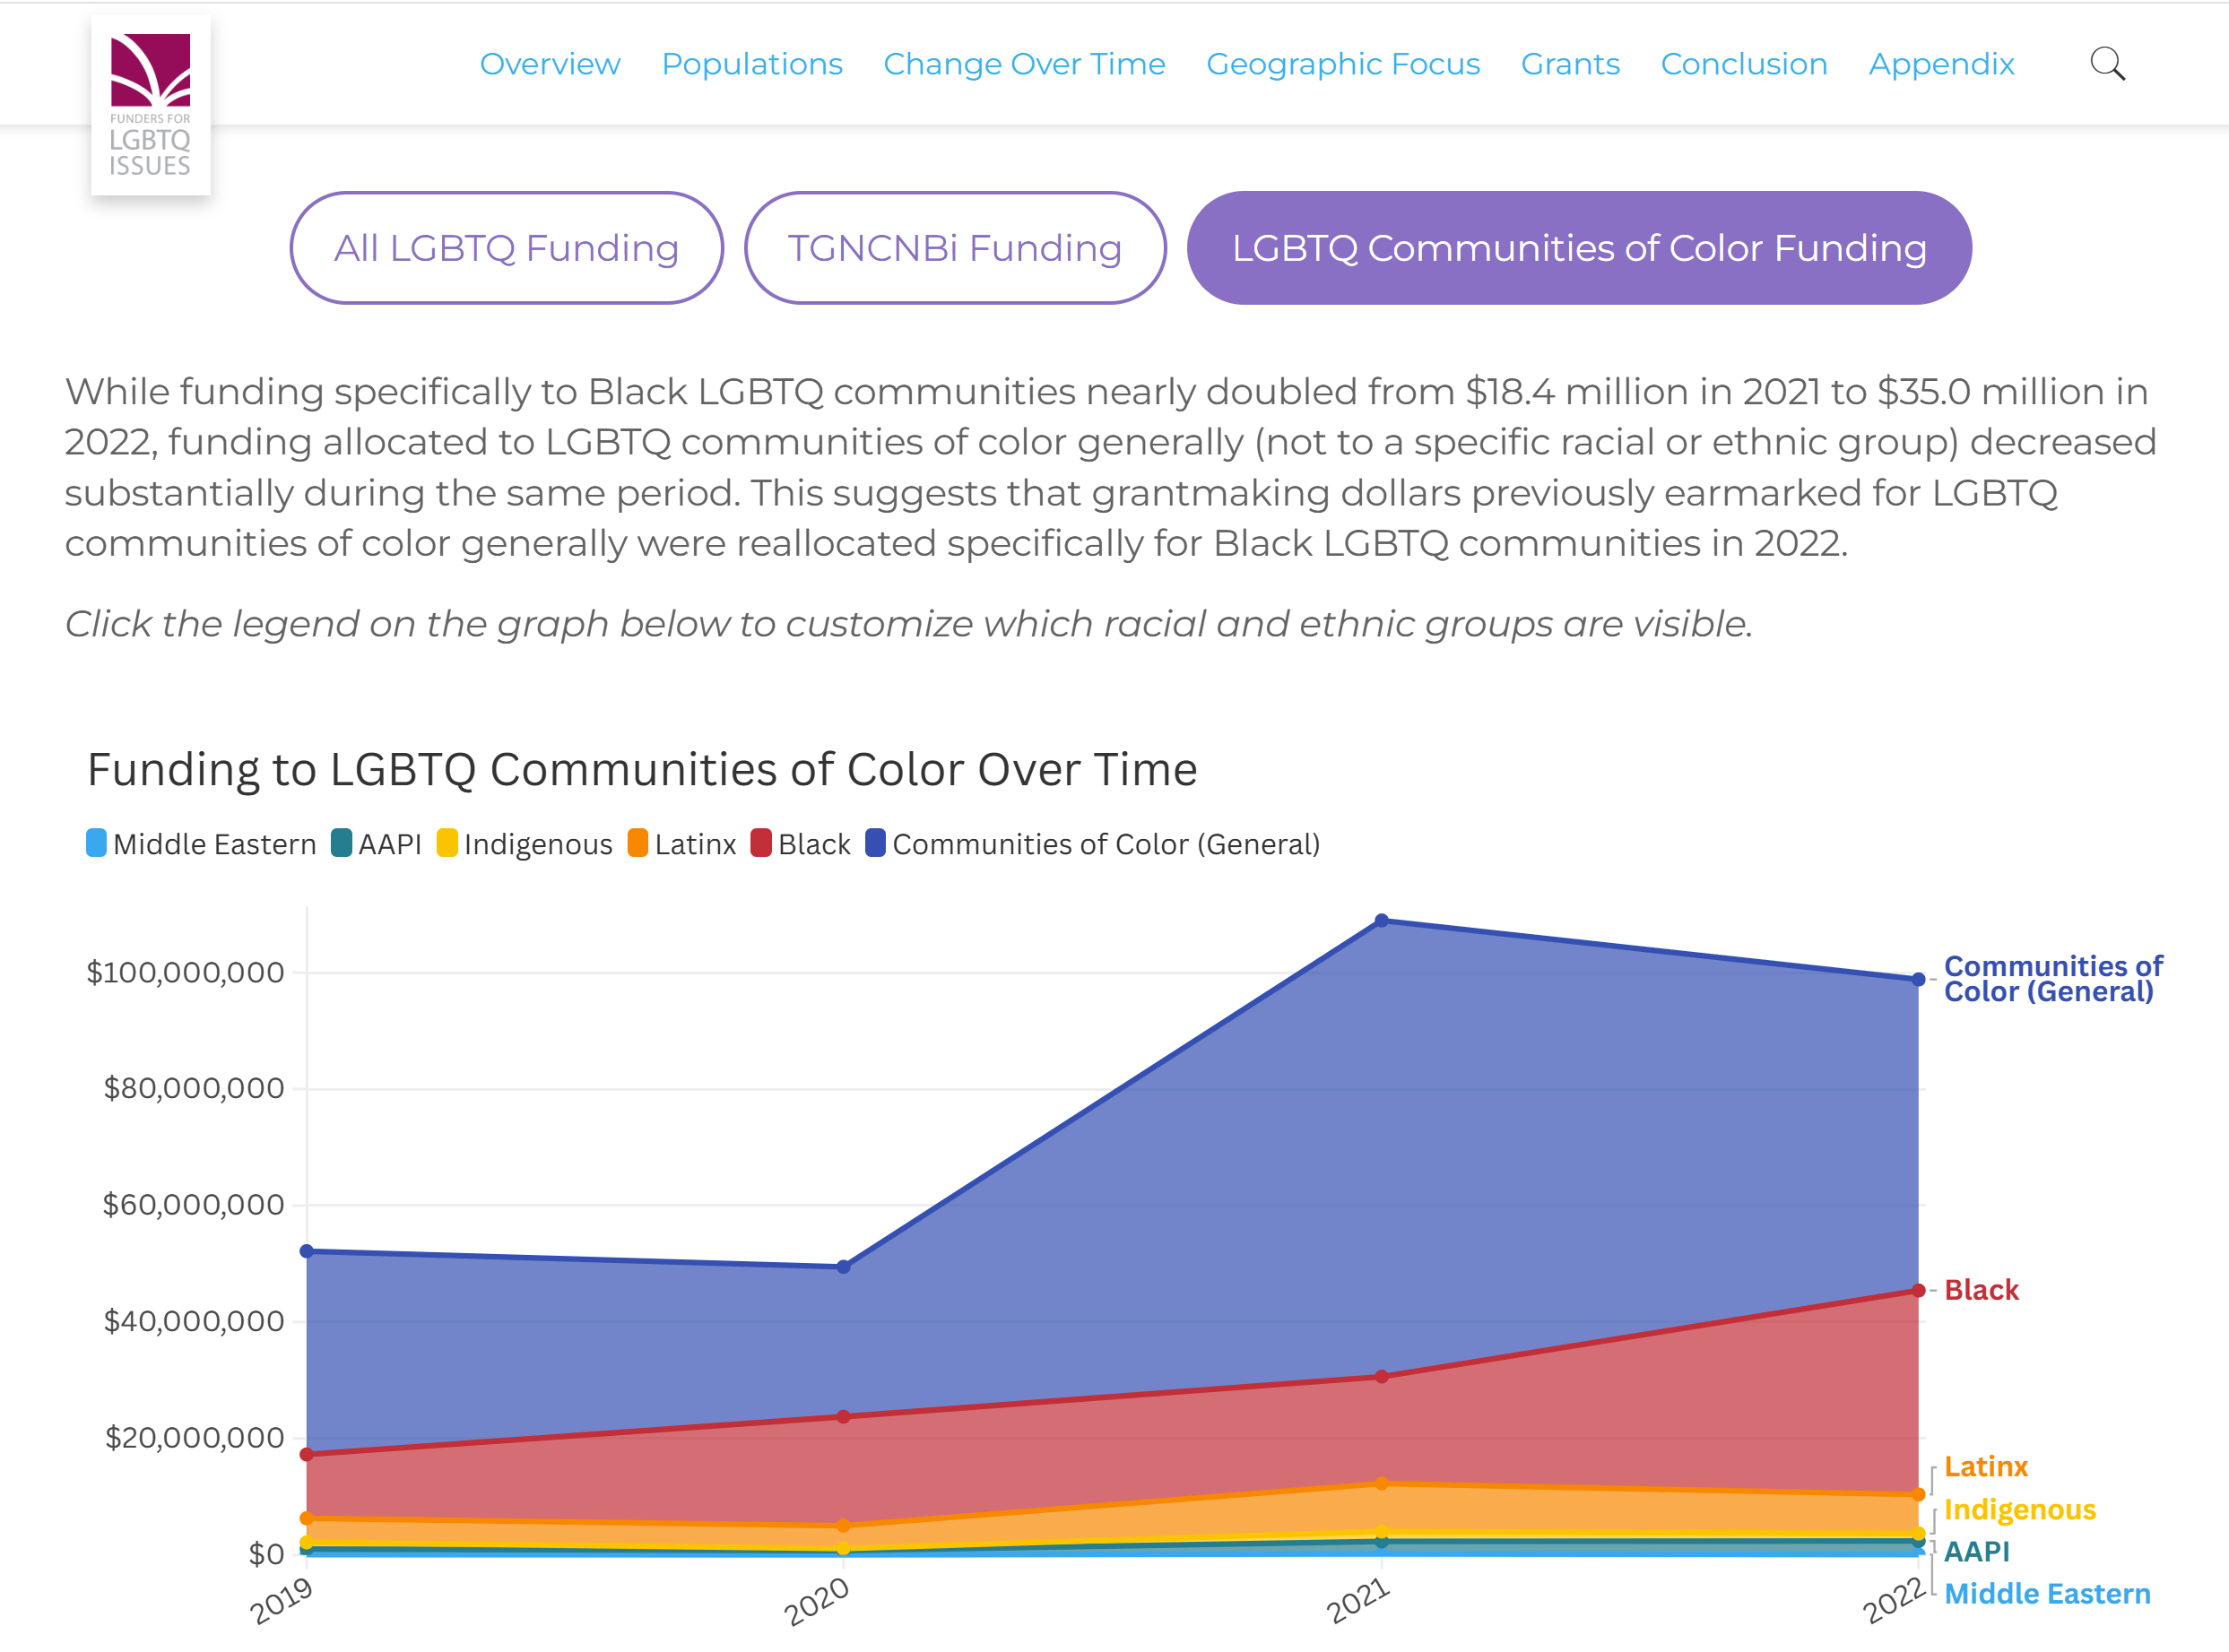
LGBTQ Funding Data Explorer
An interactive data visualization site created for Funders for LGBTQ Issues. The site presents the key findings of the 2022 Resource Tracking Report: LGBTQ Grantmaking by U.S. Foundations. The report compiles grant data to track philanthropic support for LGBTQ communities and causes in the U.S. Conducted analysis for the report and designed and developed the website.
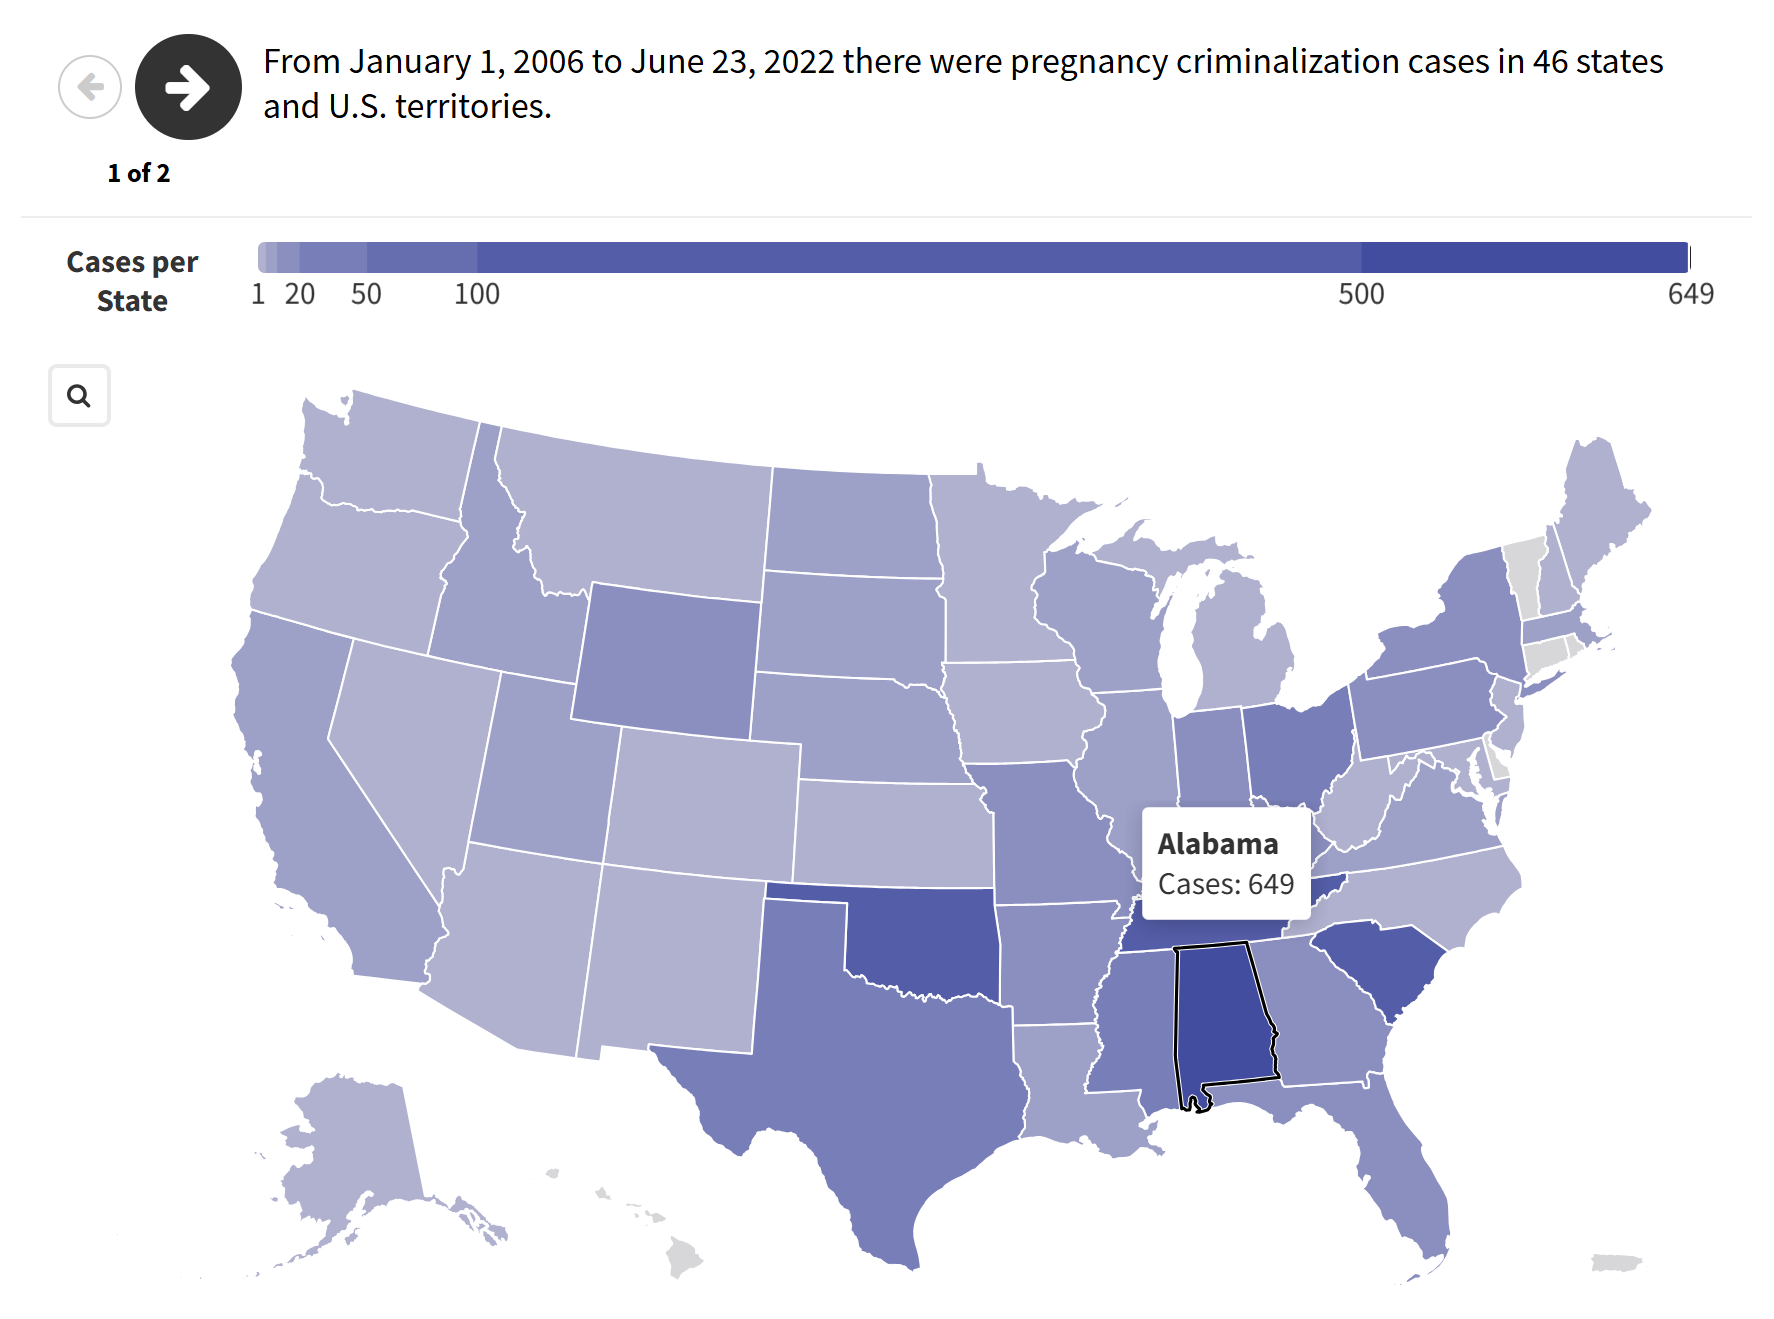
Pregnancy Criminalization Data Center
An interactive data visualization site summarizing the key findings of The Rise of Pregnancy Criminalization: A Pregnancy Justice Report. Conducted analysis for the report, created static visualizations, and designed and developed the website. Report received national news coverage, including in The Guardian and The Appeal.
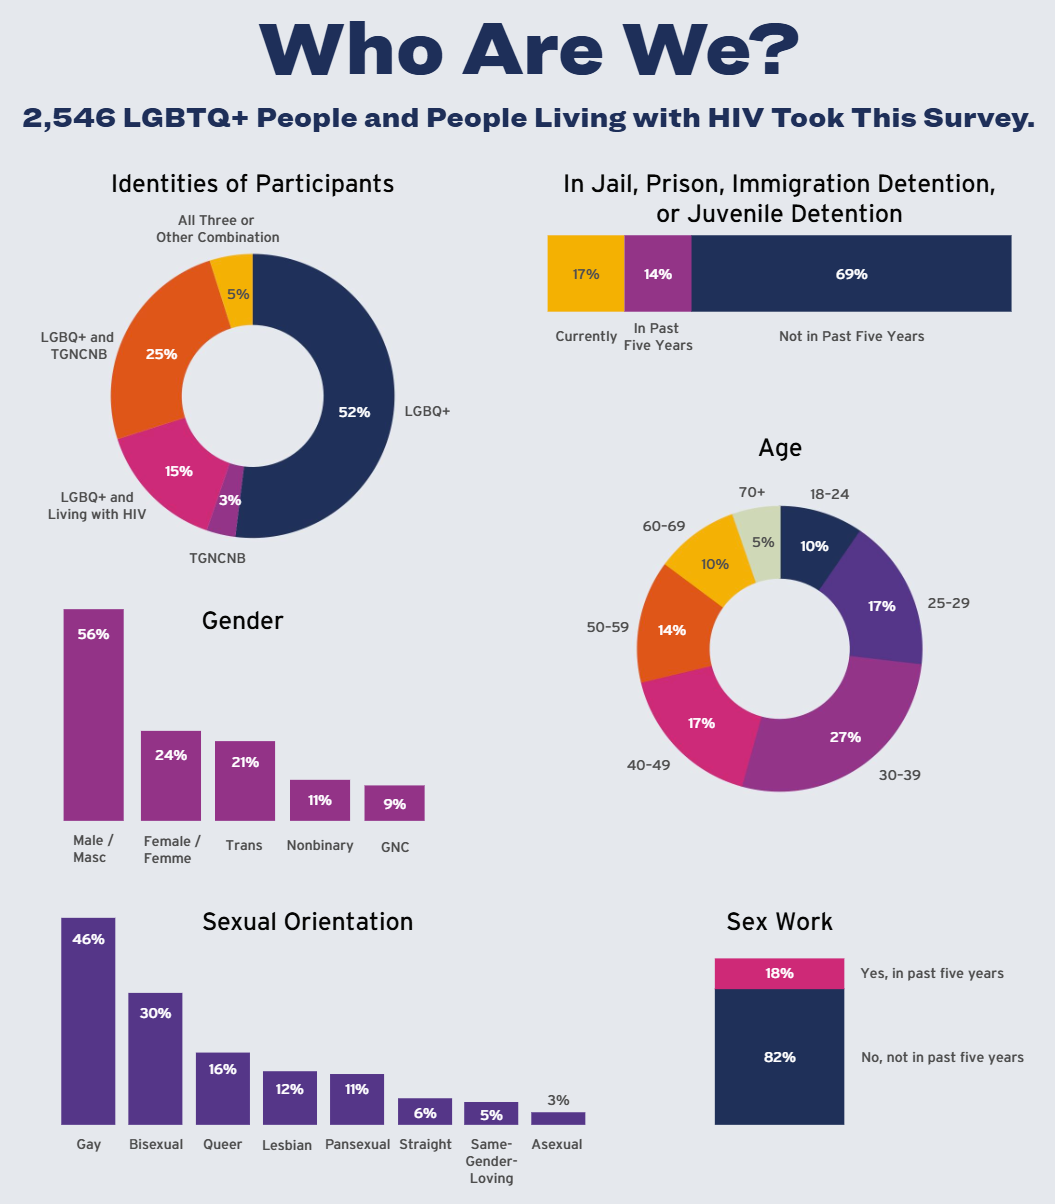
Protected & Served?
A collaboration between Lambda Legal, Black and Pink National, and Strength in Numbers Consulting Group that looks at data gathered from over 2,500 LGBTQ+ people and people living with HIV about their experiences with misconduct involving police, courts, prisons, jails, schools, and other government agencies. Conducted analysis and wrote the supplementary report on the survey responses from participants in jail and prison, Spotlight Report: Detained Participants. Created all data visualizations for the full report and all supplements.
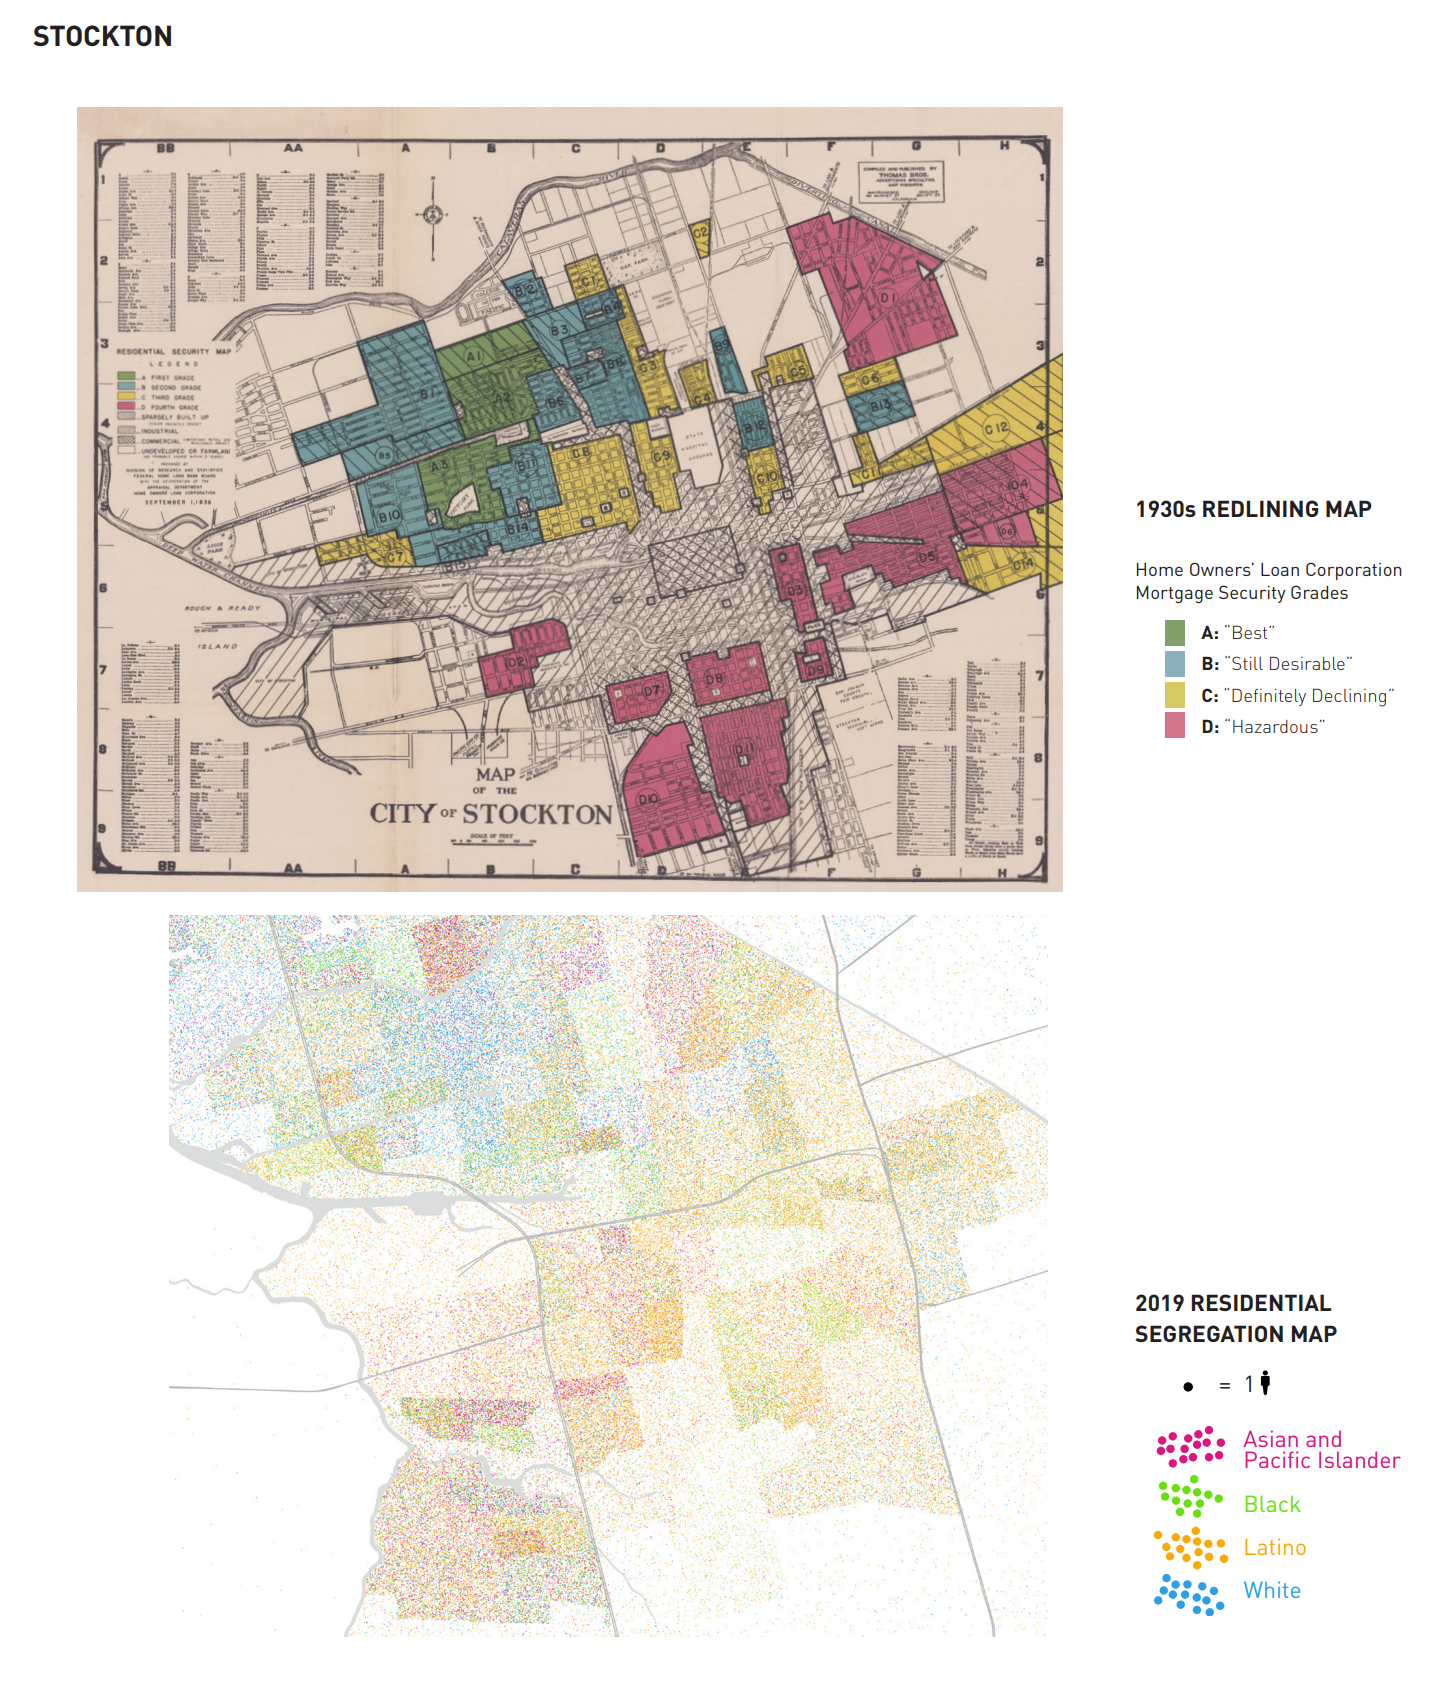
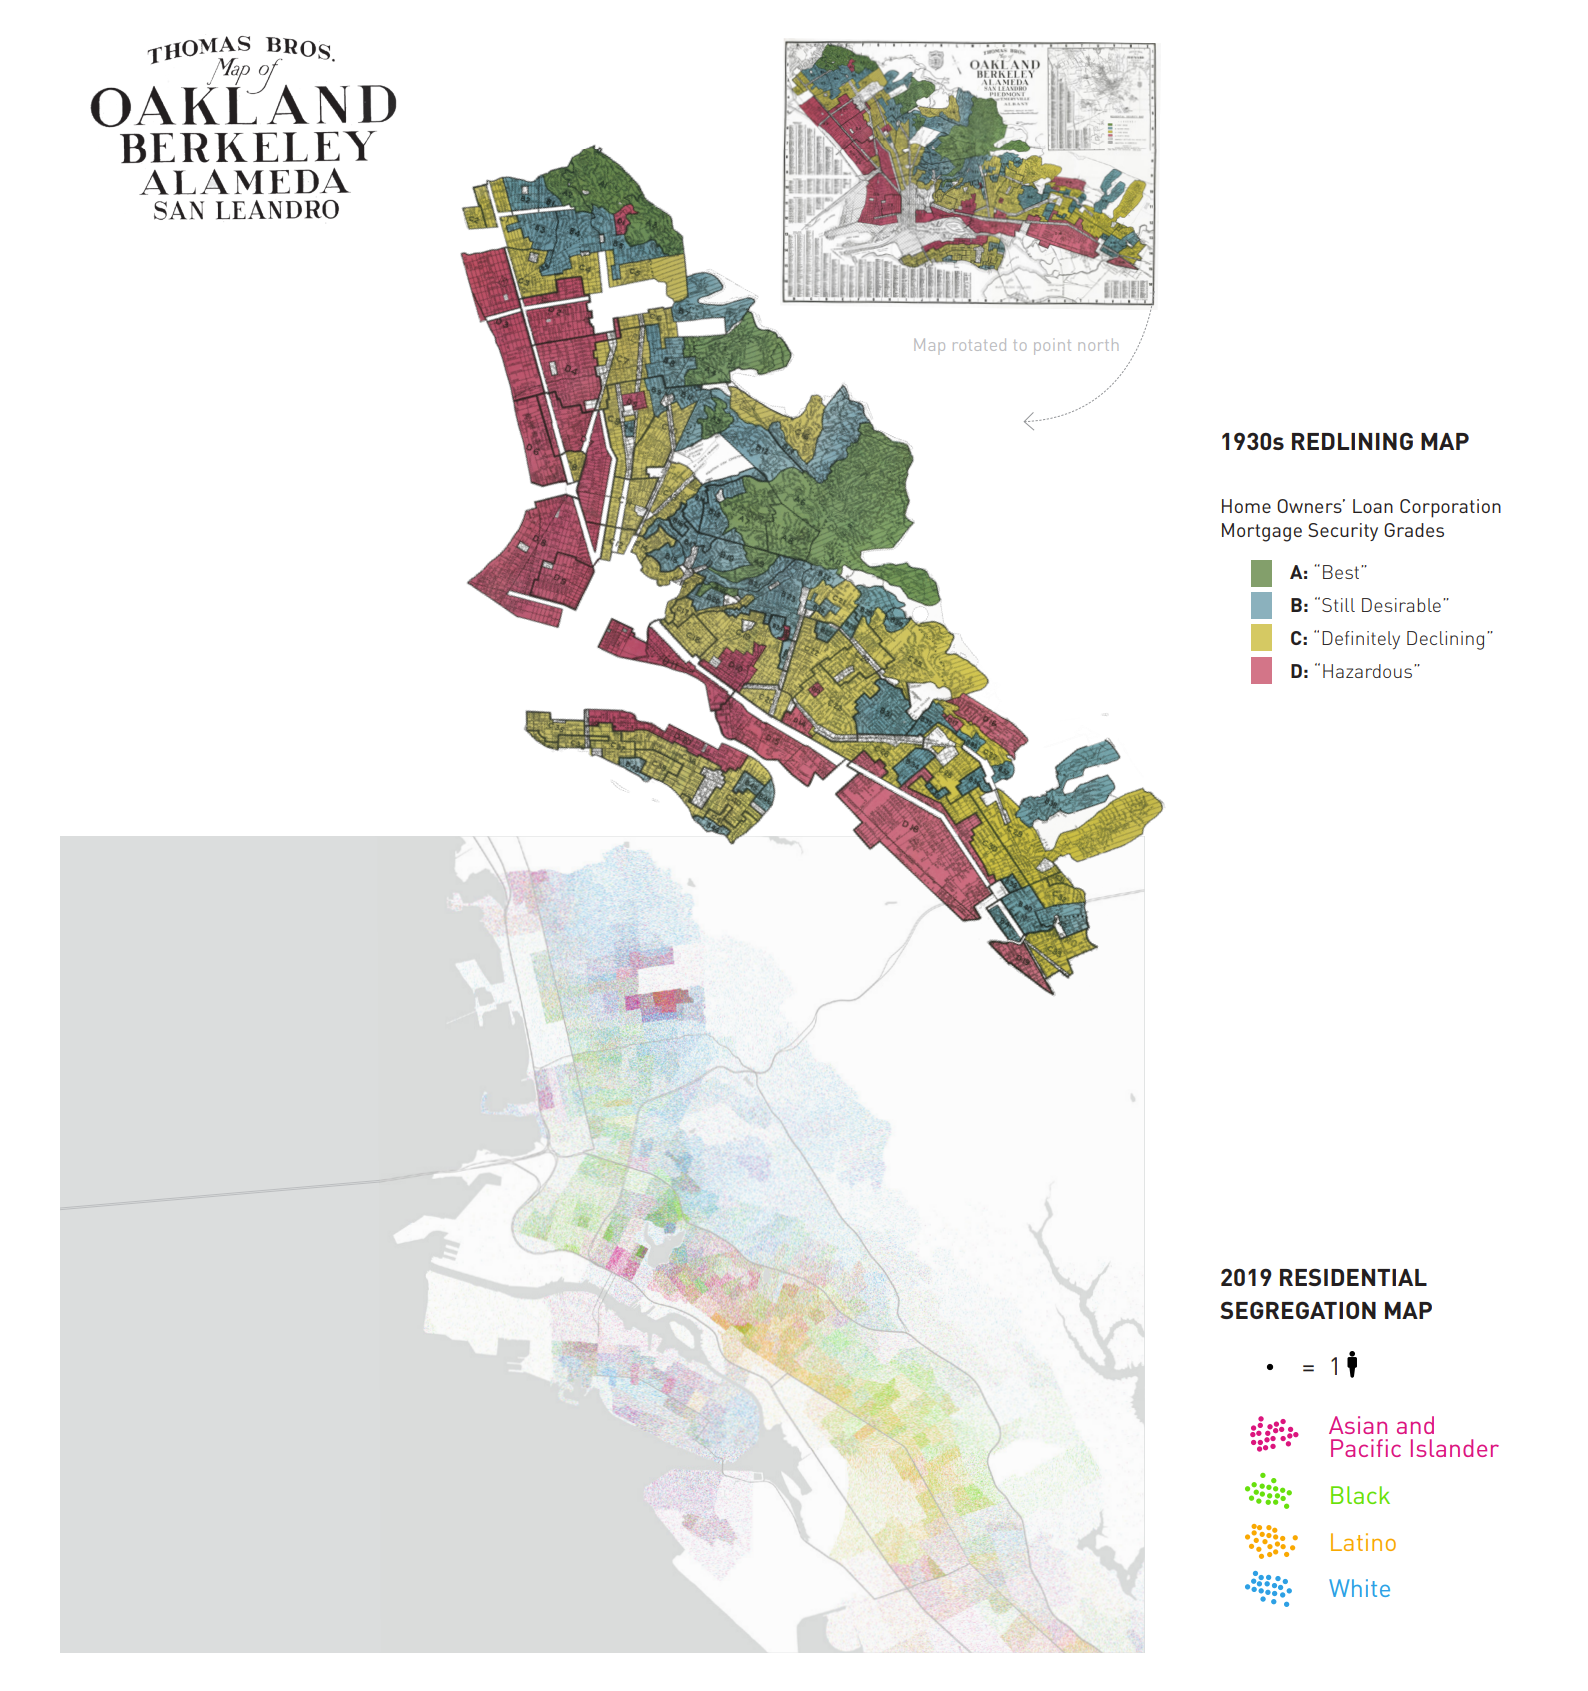
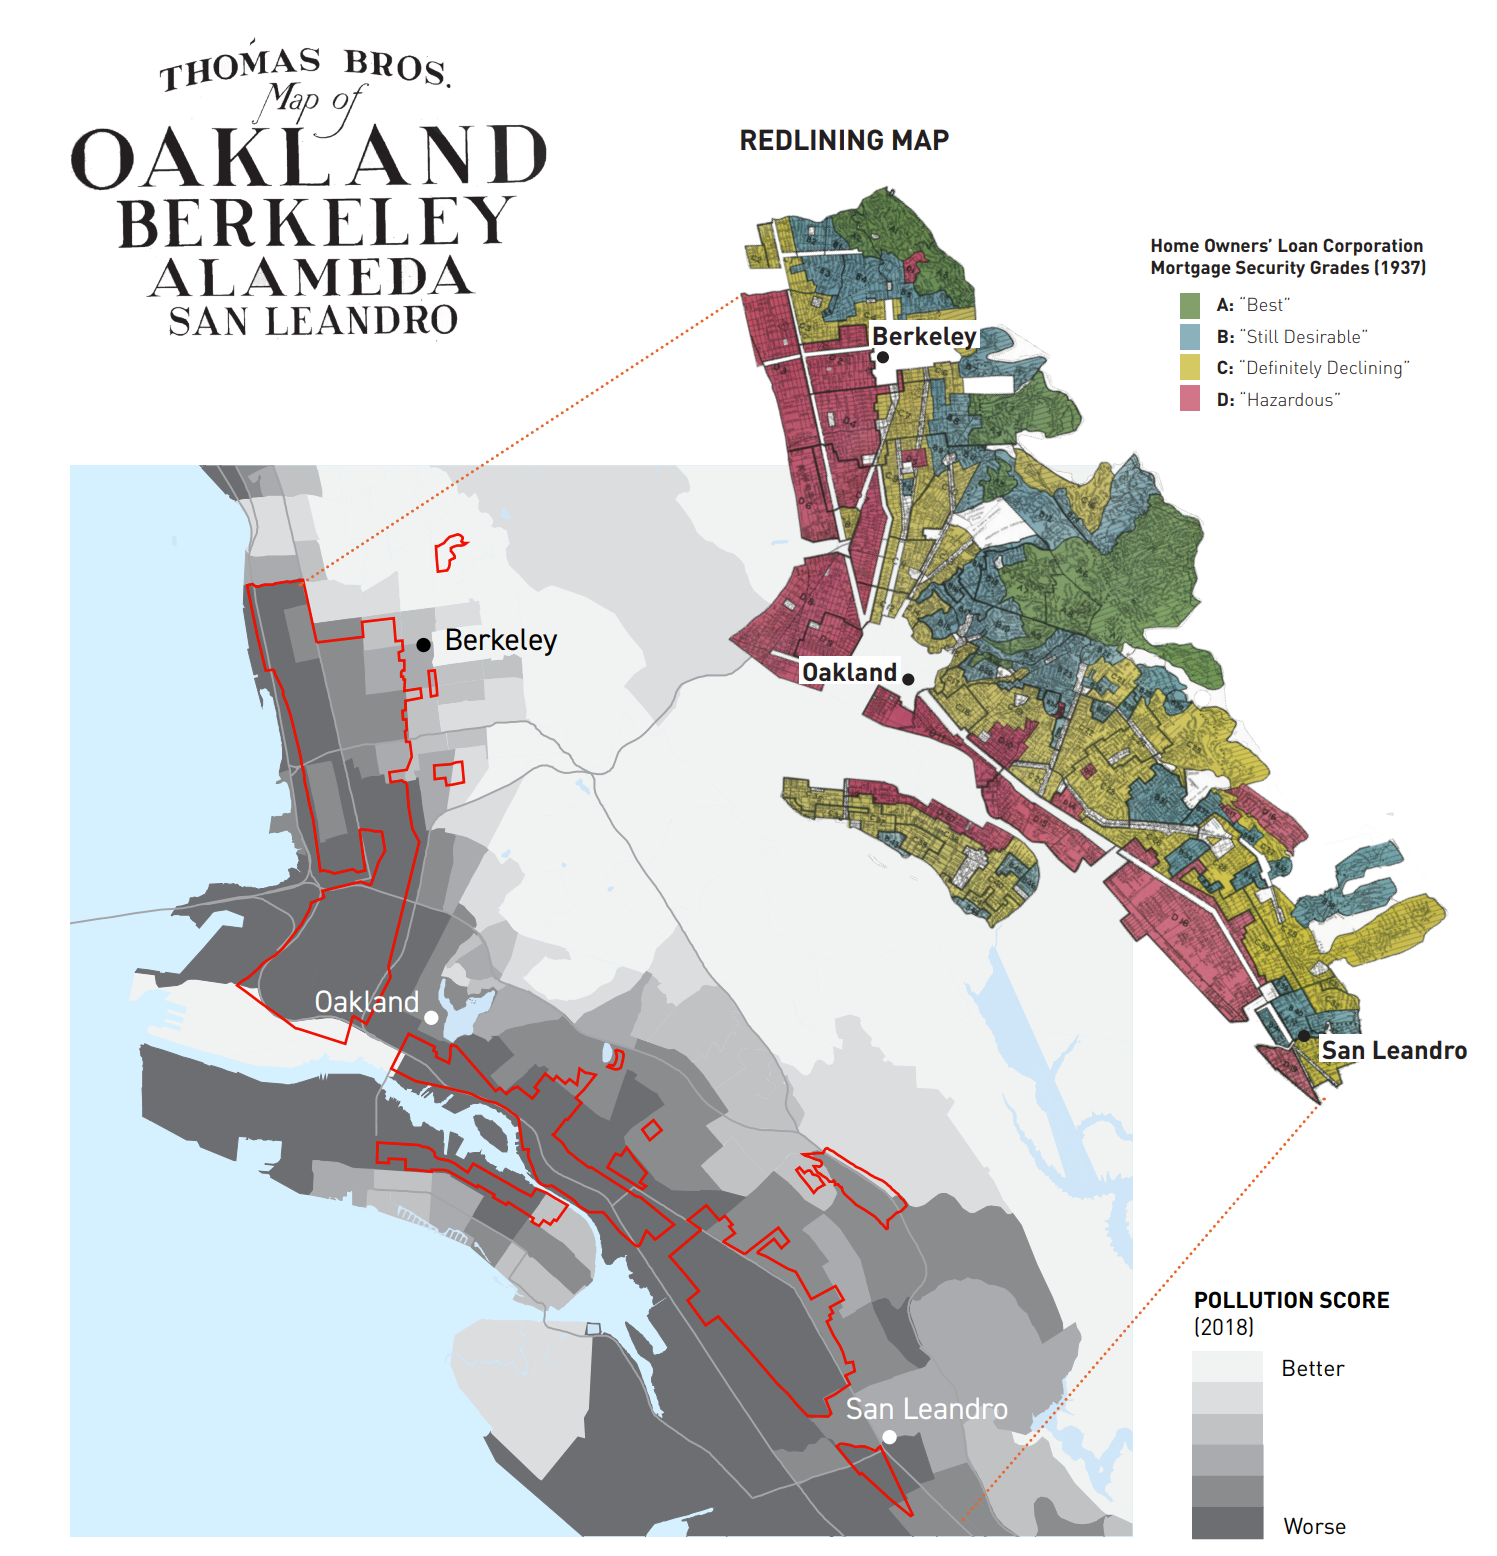
A Portrait of California
A Measure of America report presenting the American Human Development Index for various groups and geographies across the state. Calculated HDI scores from U.S. Census Bureau education and earnings data and life expectancy estimates calculated from raw mortality data. Wrote "A Decent Standard of Living" chapter and collaborated with Humantific on report design and data visualization. Created all maps, including those pictured here comparing Home Owners’ Loan Corporation redlining maps with current-day residential segregation and pollution. Report received state-wide news coverage, including in CalMatters and the San Francisco Examiner.
Investigation of Gunshot Fatality and Access to Trauma Care in The Trace & THE CITY
A multi-month investigation into differences in gunshot fatality rates across NYC, in collaboration with journalists Sean Campbell and Maya Miller. Conducted spatial analysis, co-wrote article, and created graphics. Within a week of publication, all candidates for Queens Borough President had pledged to address disparities in hospital access, and in 2023, New York State committed $150 million to expand Jamaica Hospital's emergency department.
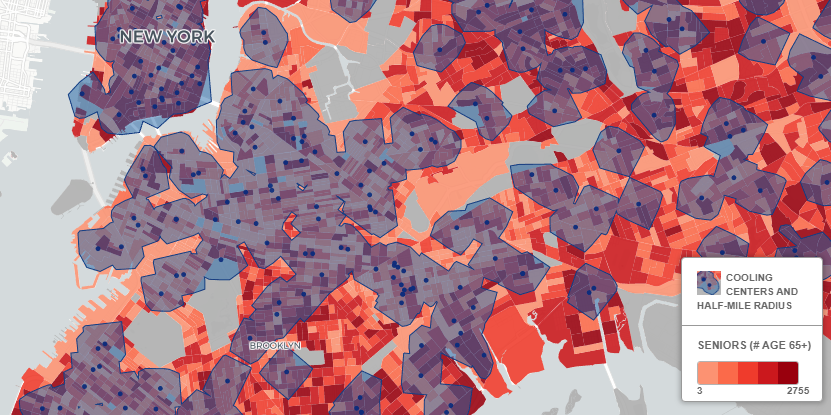
Cooling Centers on Gothamist & WNYC
Analysis on the accessibility of cooling centers to NYC seniors, conducted for WNYC and published on Gothamist. QGIS analysis and Carto interactive map.
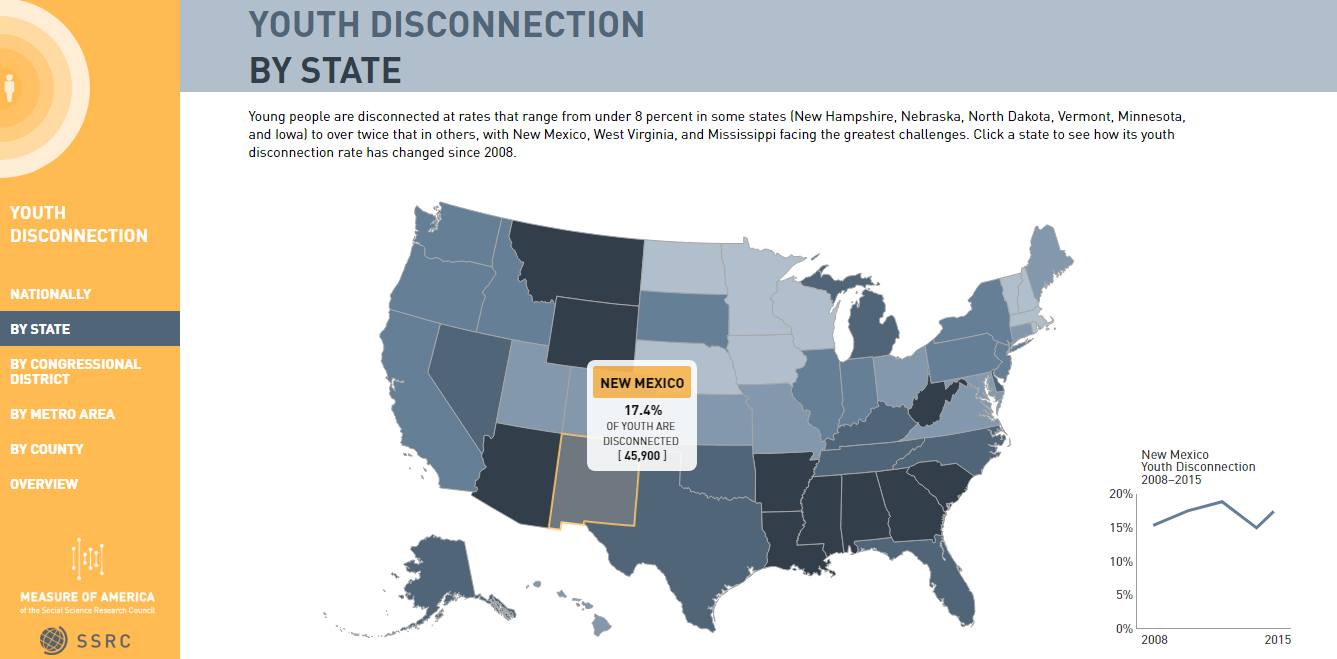
Youth Disconnection in America
A custom-built, single page website combining many D3.js maps and graphs. Released in accompaniment with Promising Gains, Persistent Gaps, the fourth report in Measure of America's series on youth disconnection, and updated annually.
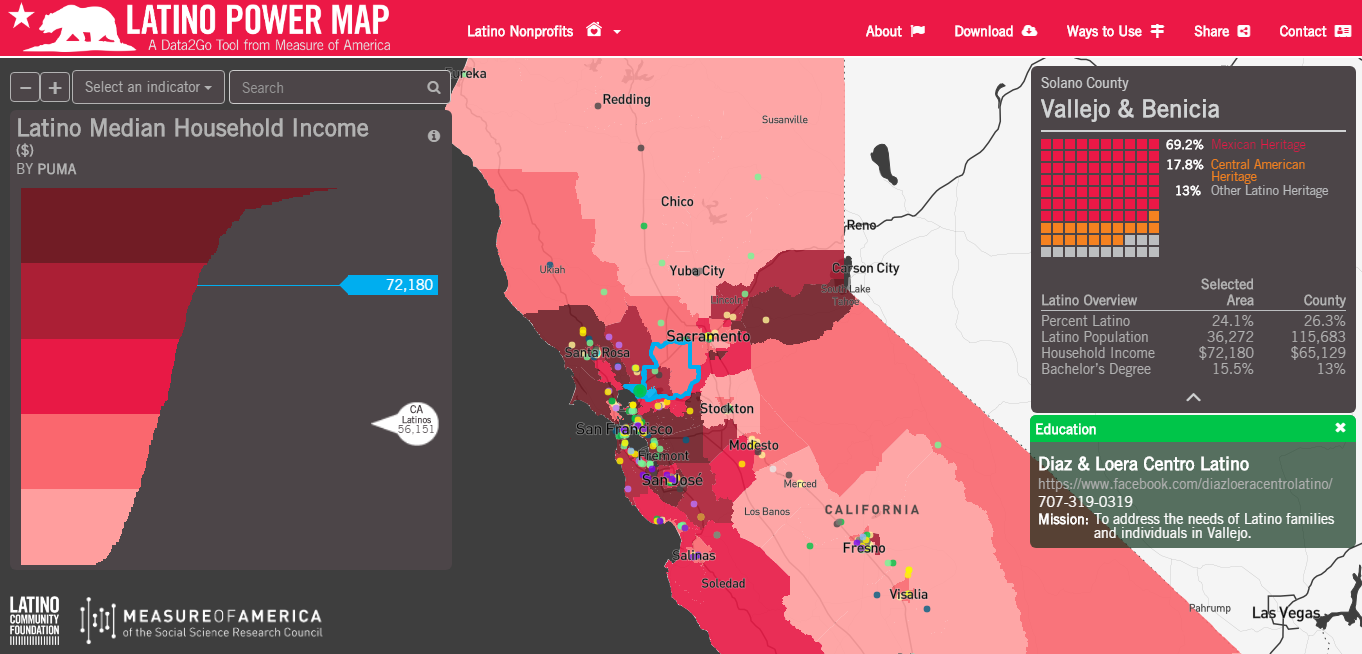
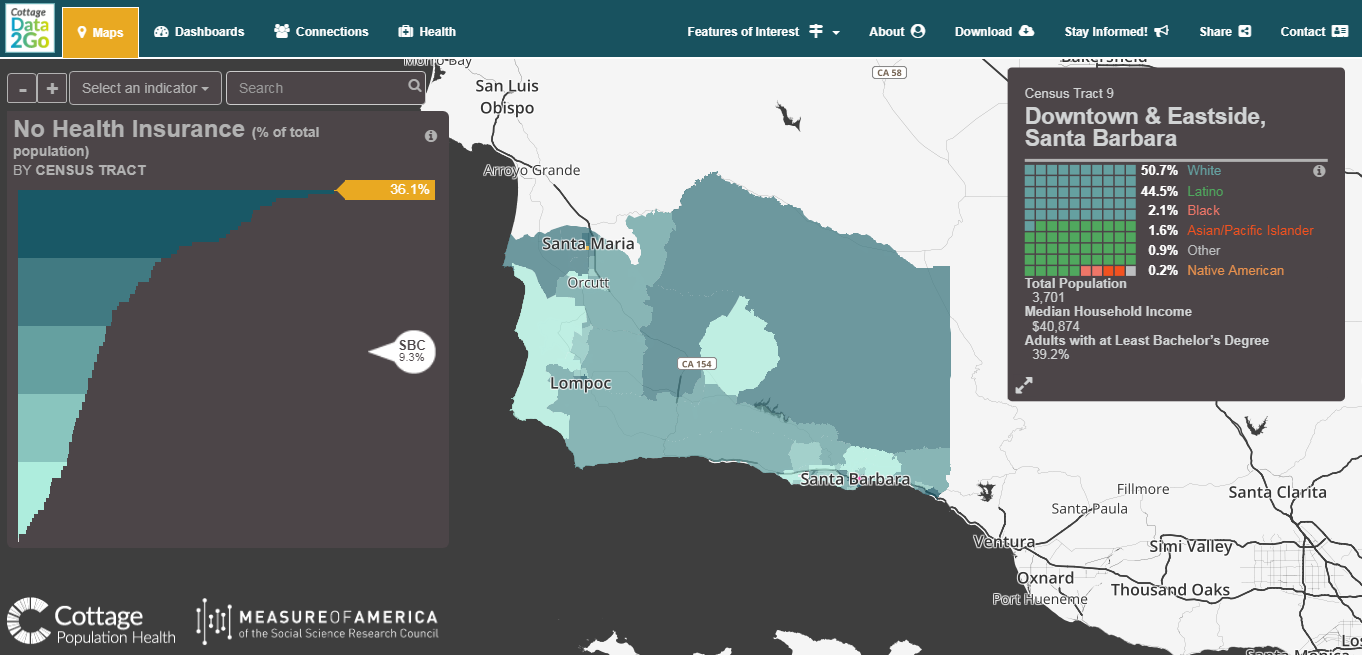
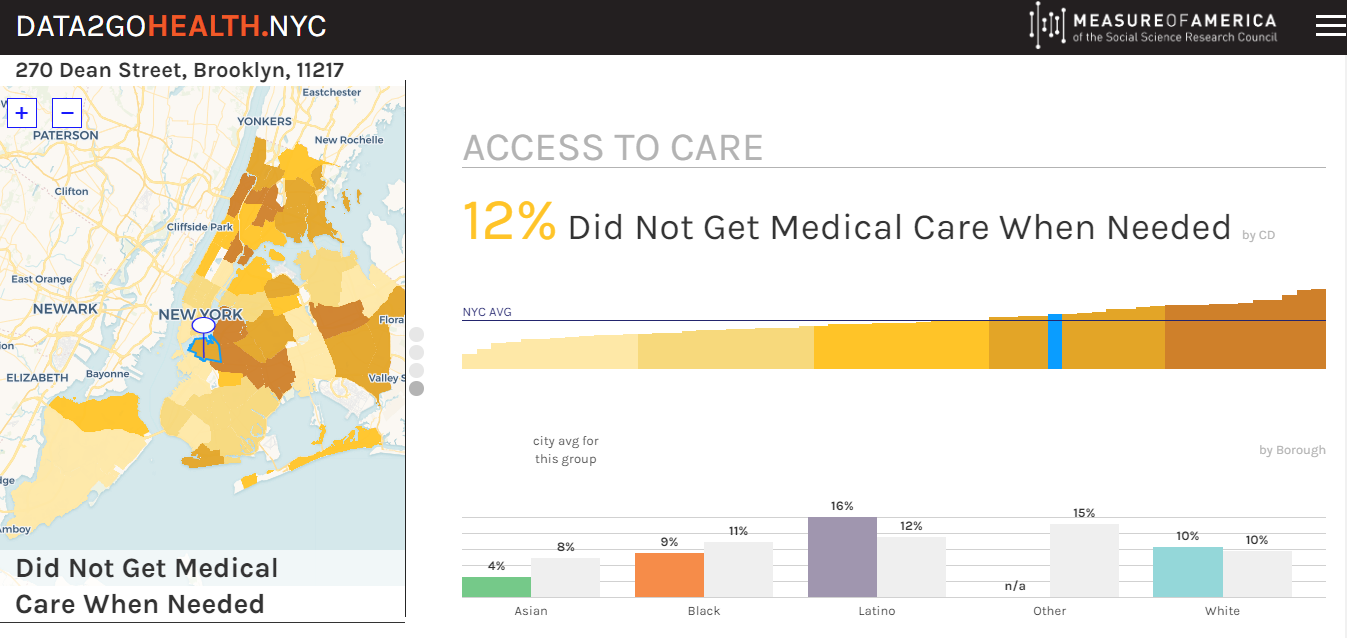
Data2Go Family of Tools
Worked on data curation and analysis, visual design, and user experience for three tools based on Measure of America's DATA2GO.NYC. For Cottage Data2Go and the California Latino Power Map, served as the primary project manager and translated user needs to technical objectives.
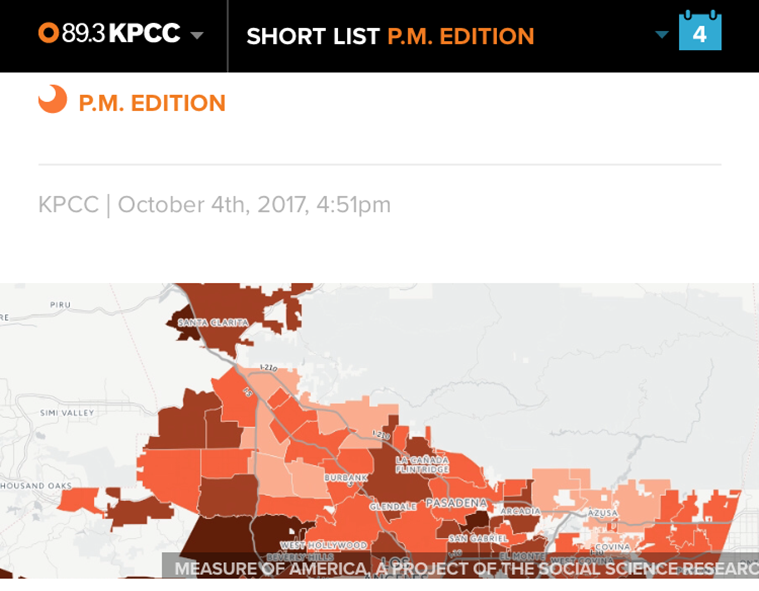
Highway to Health: Life Expectancy in Los Angeles County
A Carto map released in accompaniment with the Measure of America report Highway to Health: Life Expectancy in Los Angeles County. The report and map were the top feature on KPCC's daily Short List.
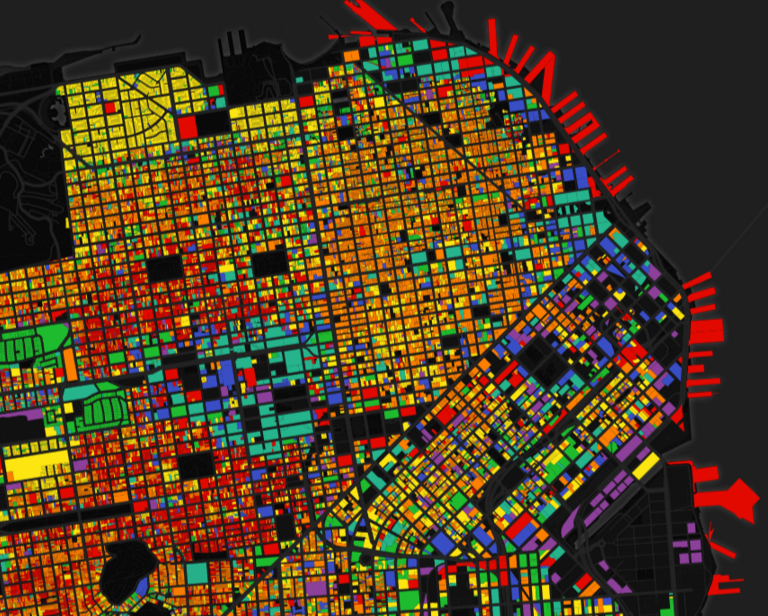
Development of San Francisco
A Carto map of the year currently standing properties were built. Click on each property for Google Street View imagery of the building. Built from SF Planning Department data, with a custom Mapbox Studio basemap.
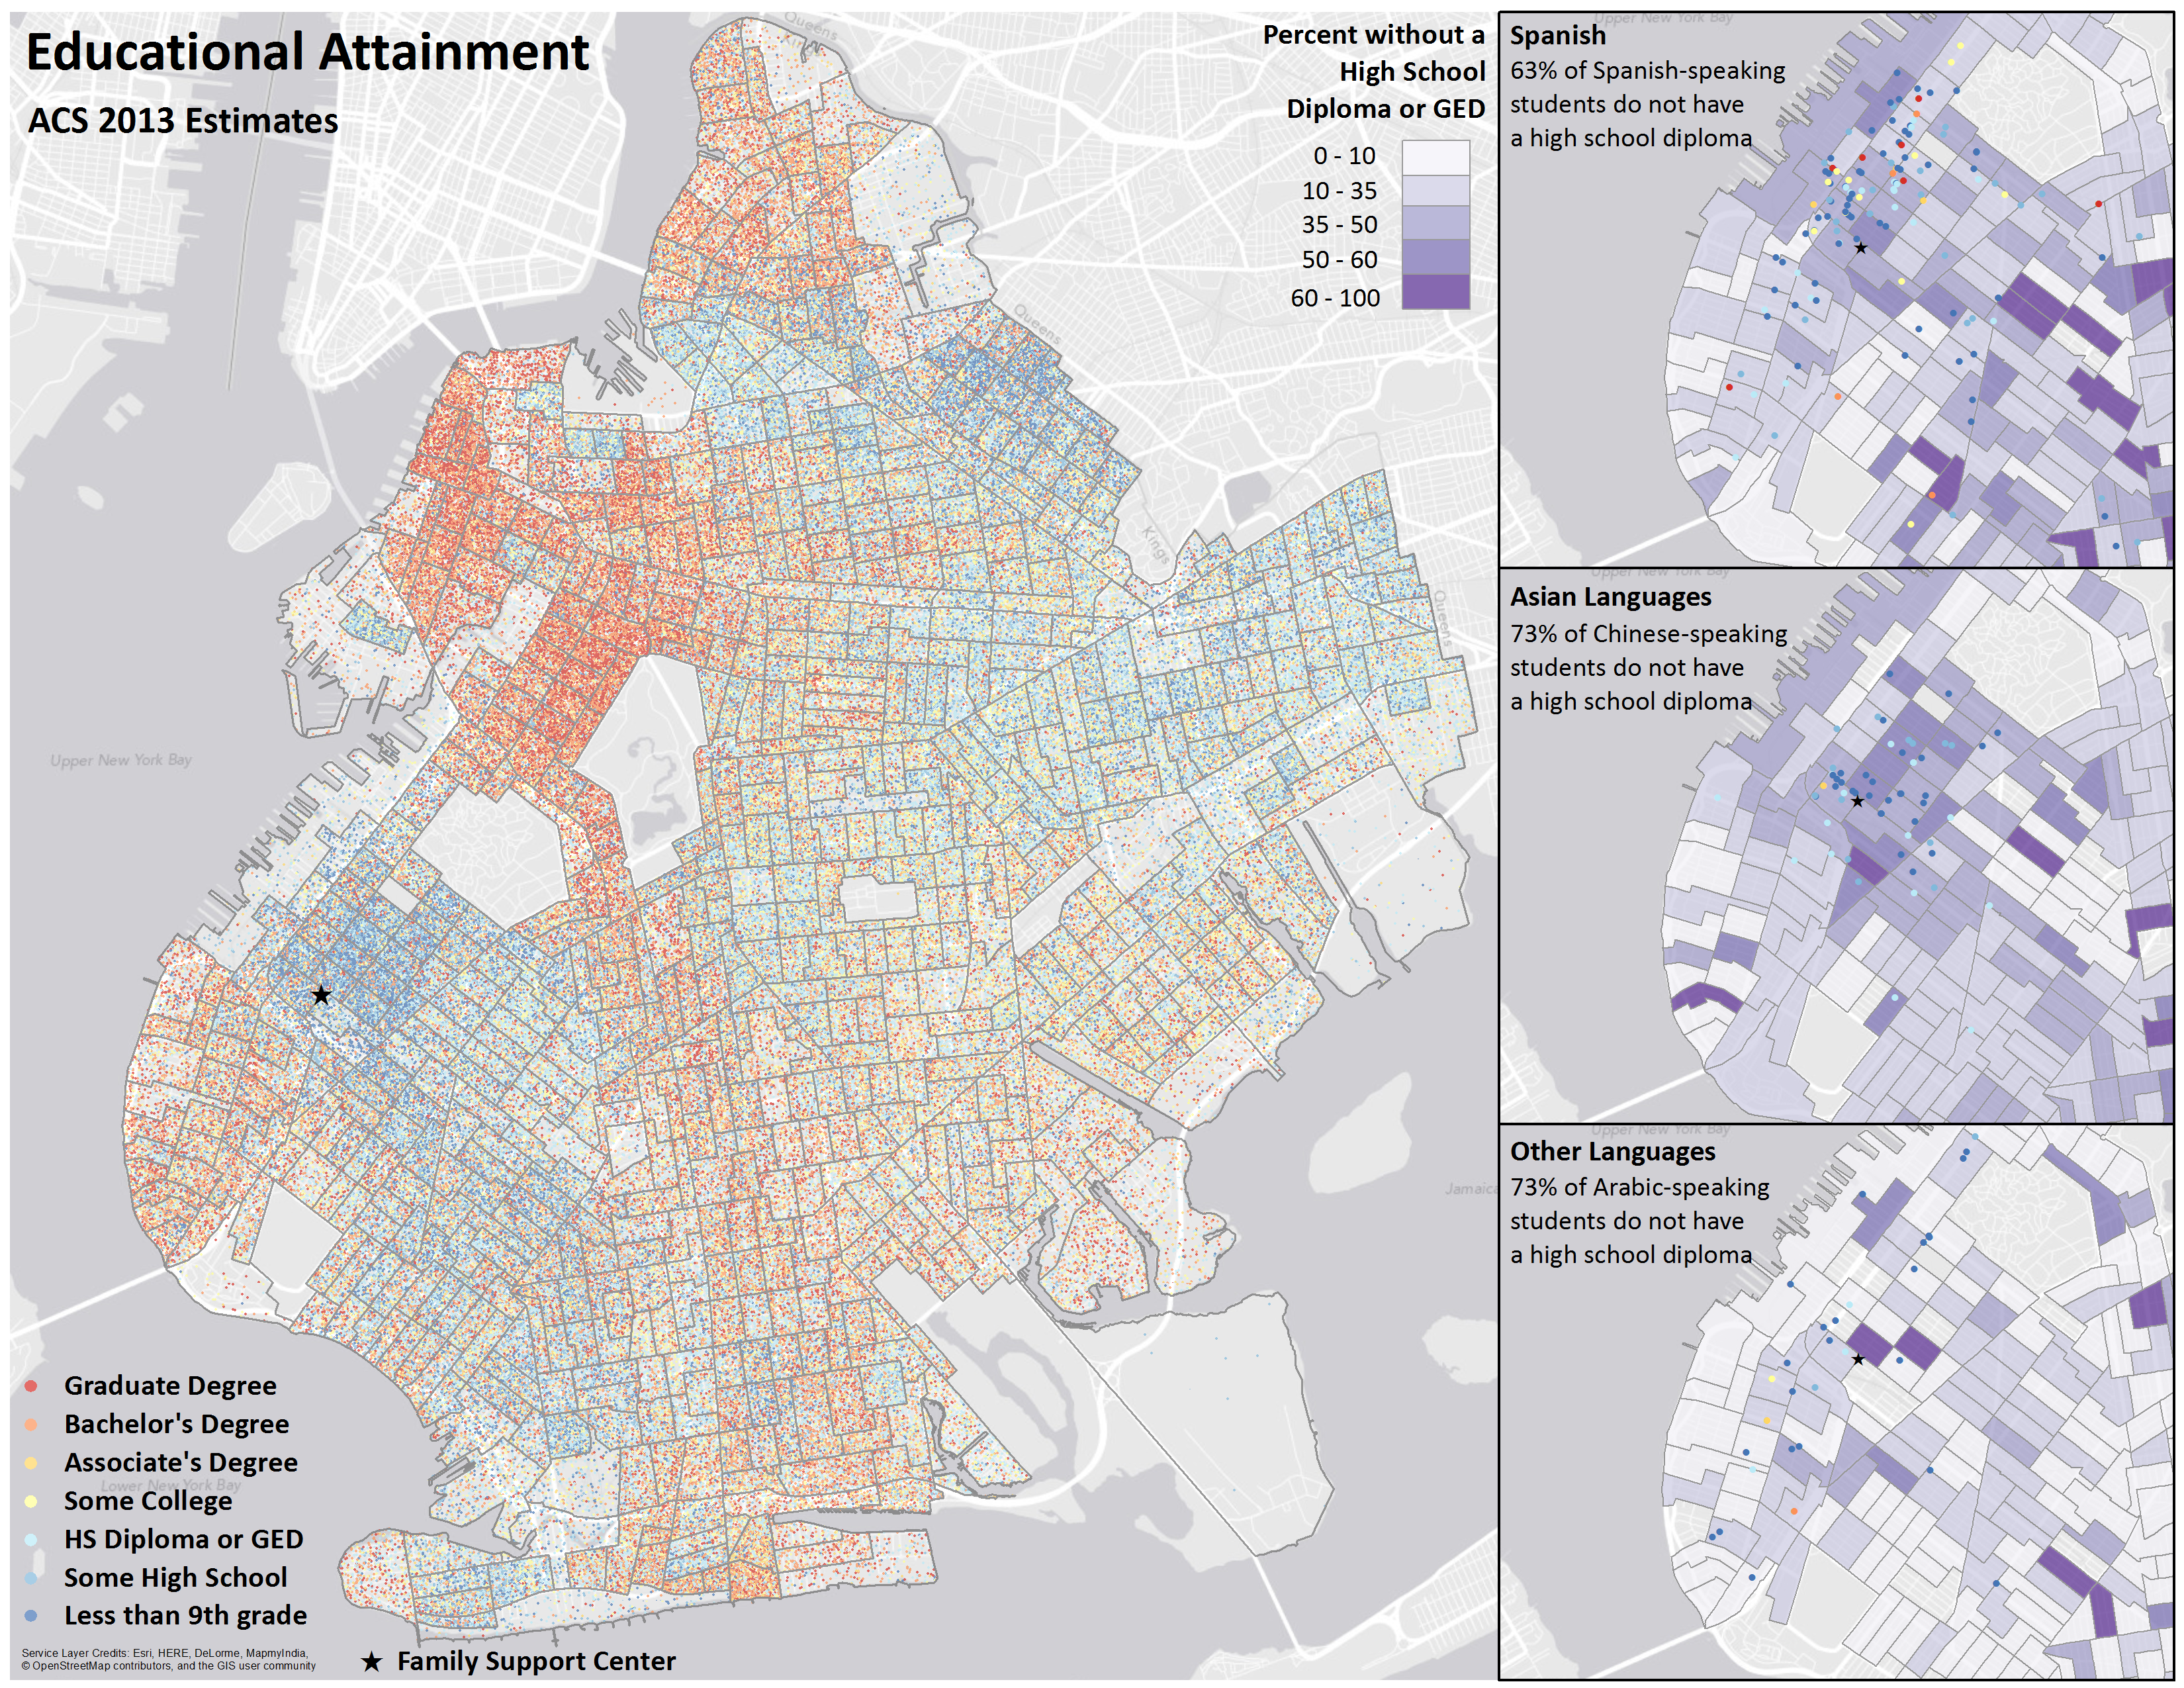
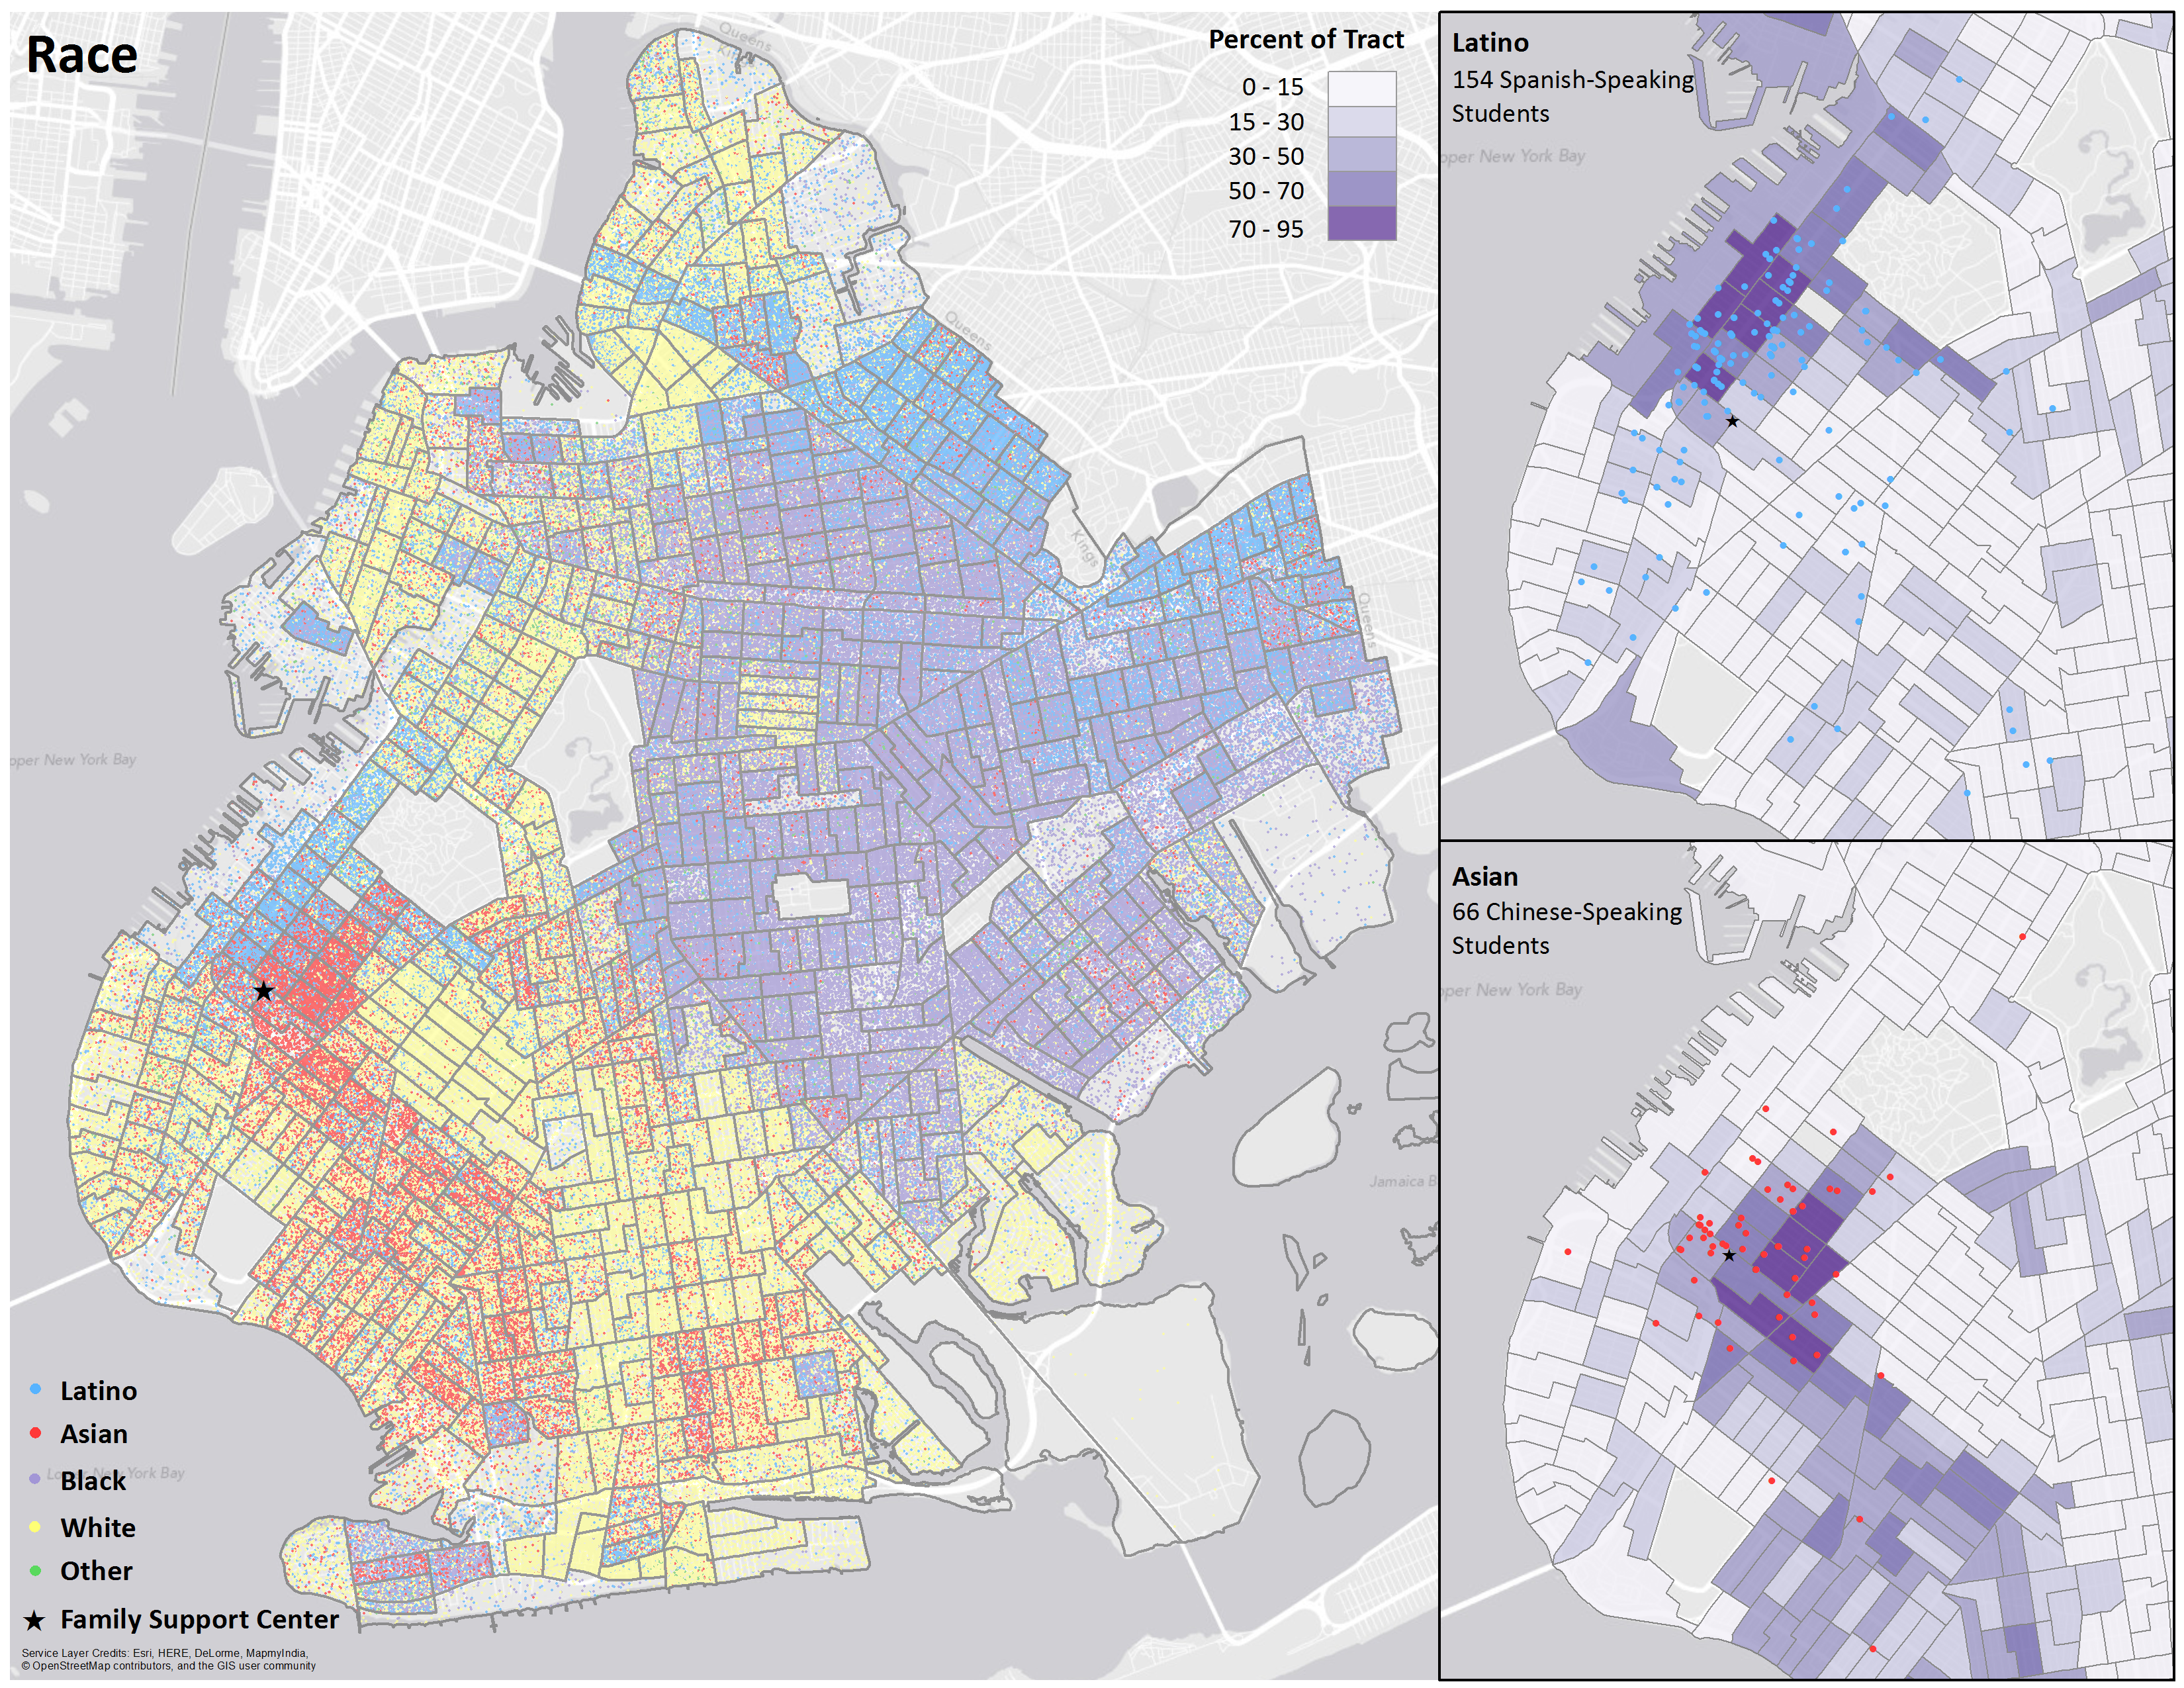
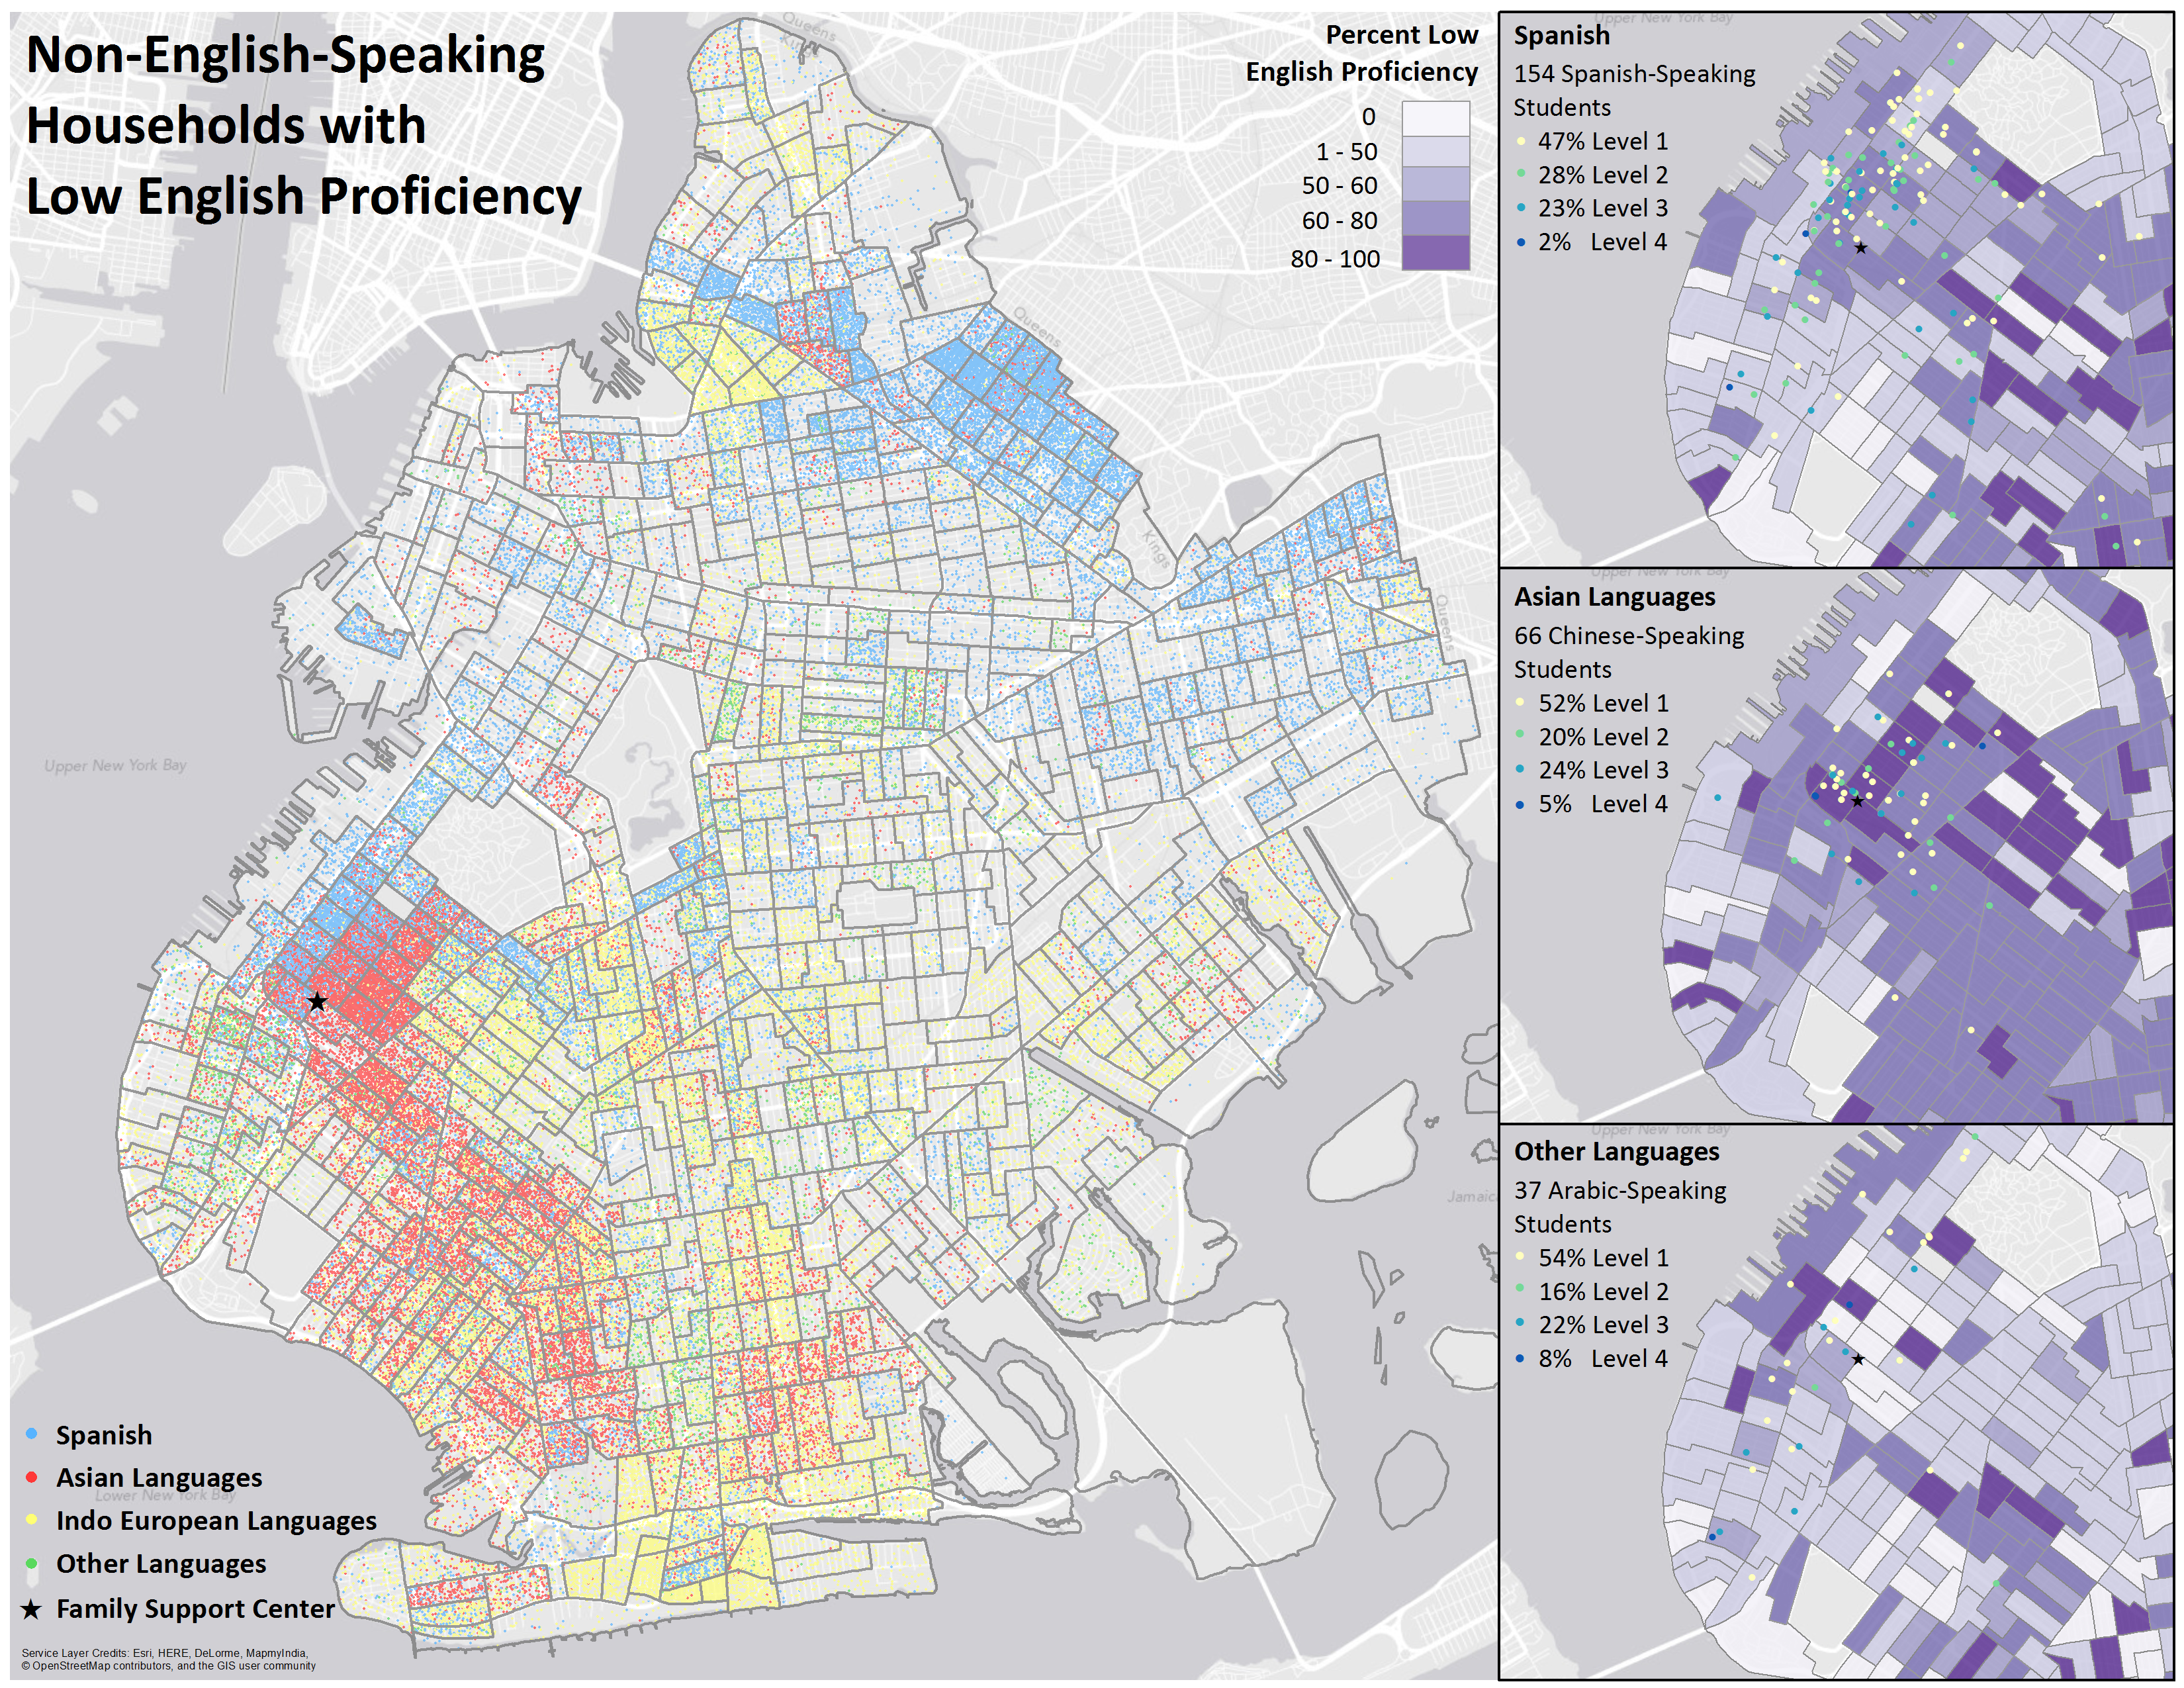
Brooklyn Demographics
A series of maps comparing Census data to the demographics of ESOL students at the NYU Lutheran Family Support Center in Sunset Park, Brooklyn. This work was completed through the Summer of Maps program at Azavea. Read more about the project here.
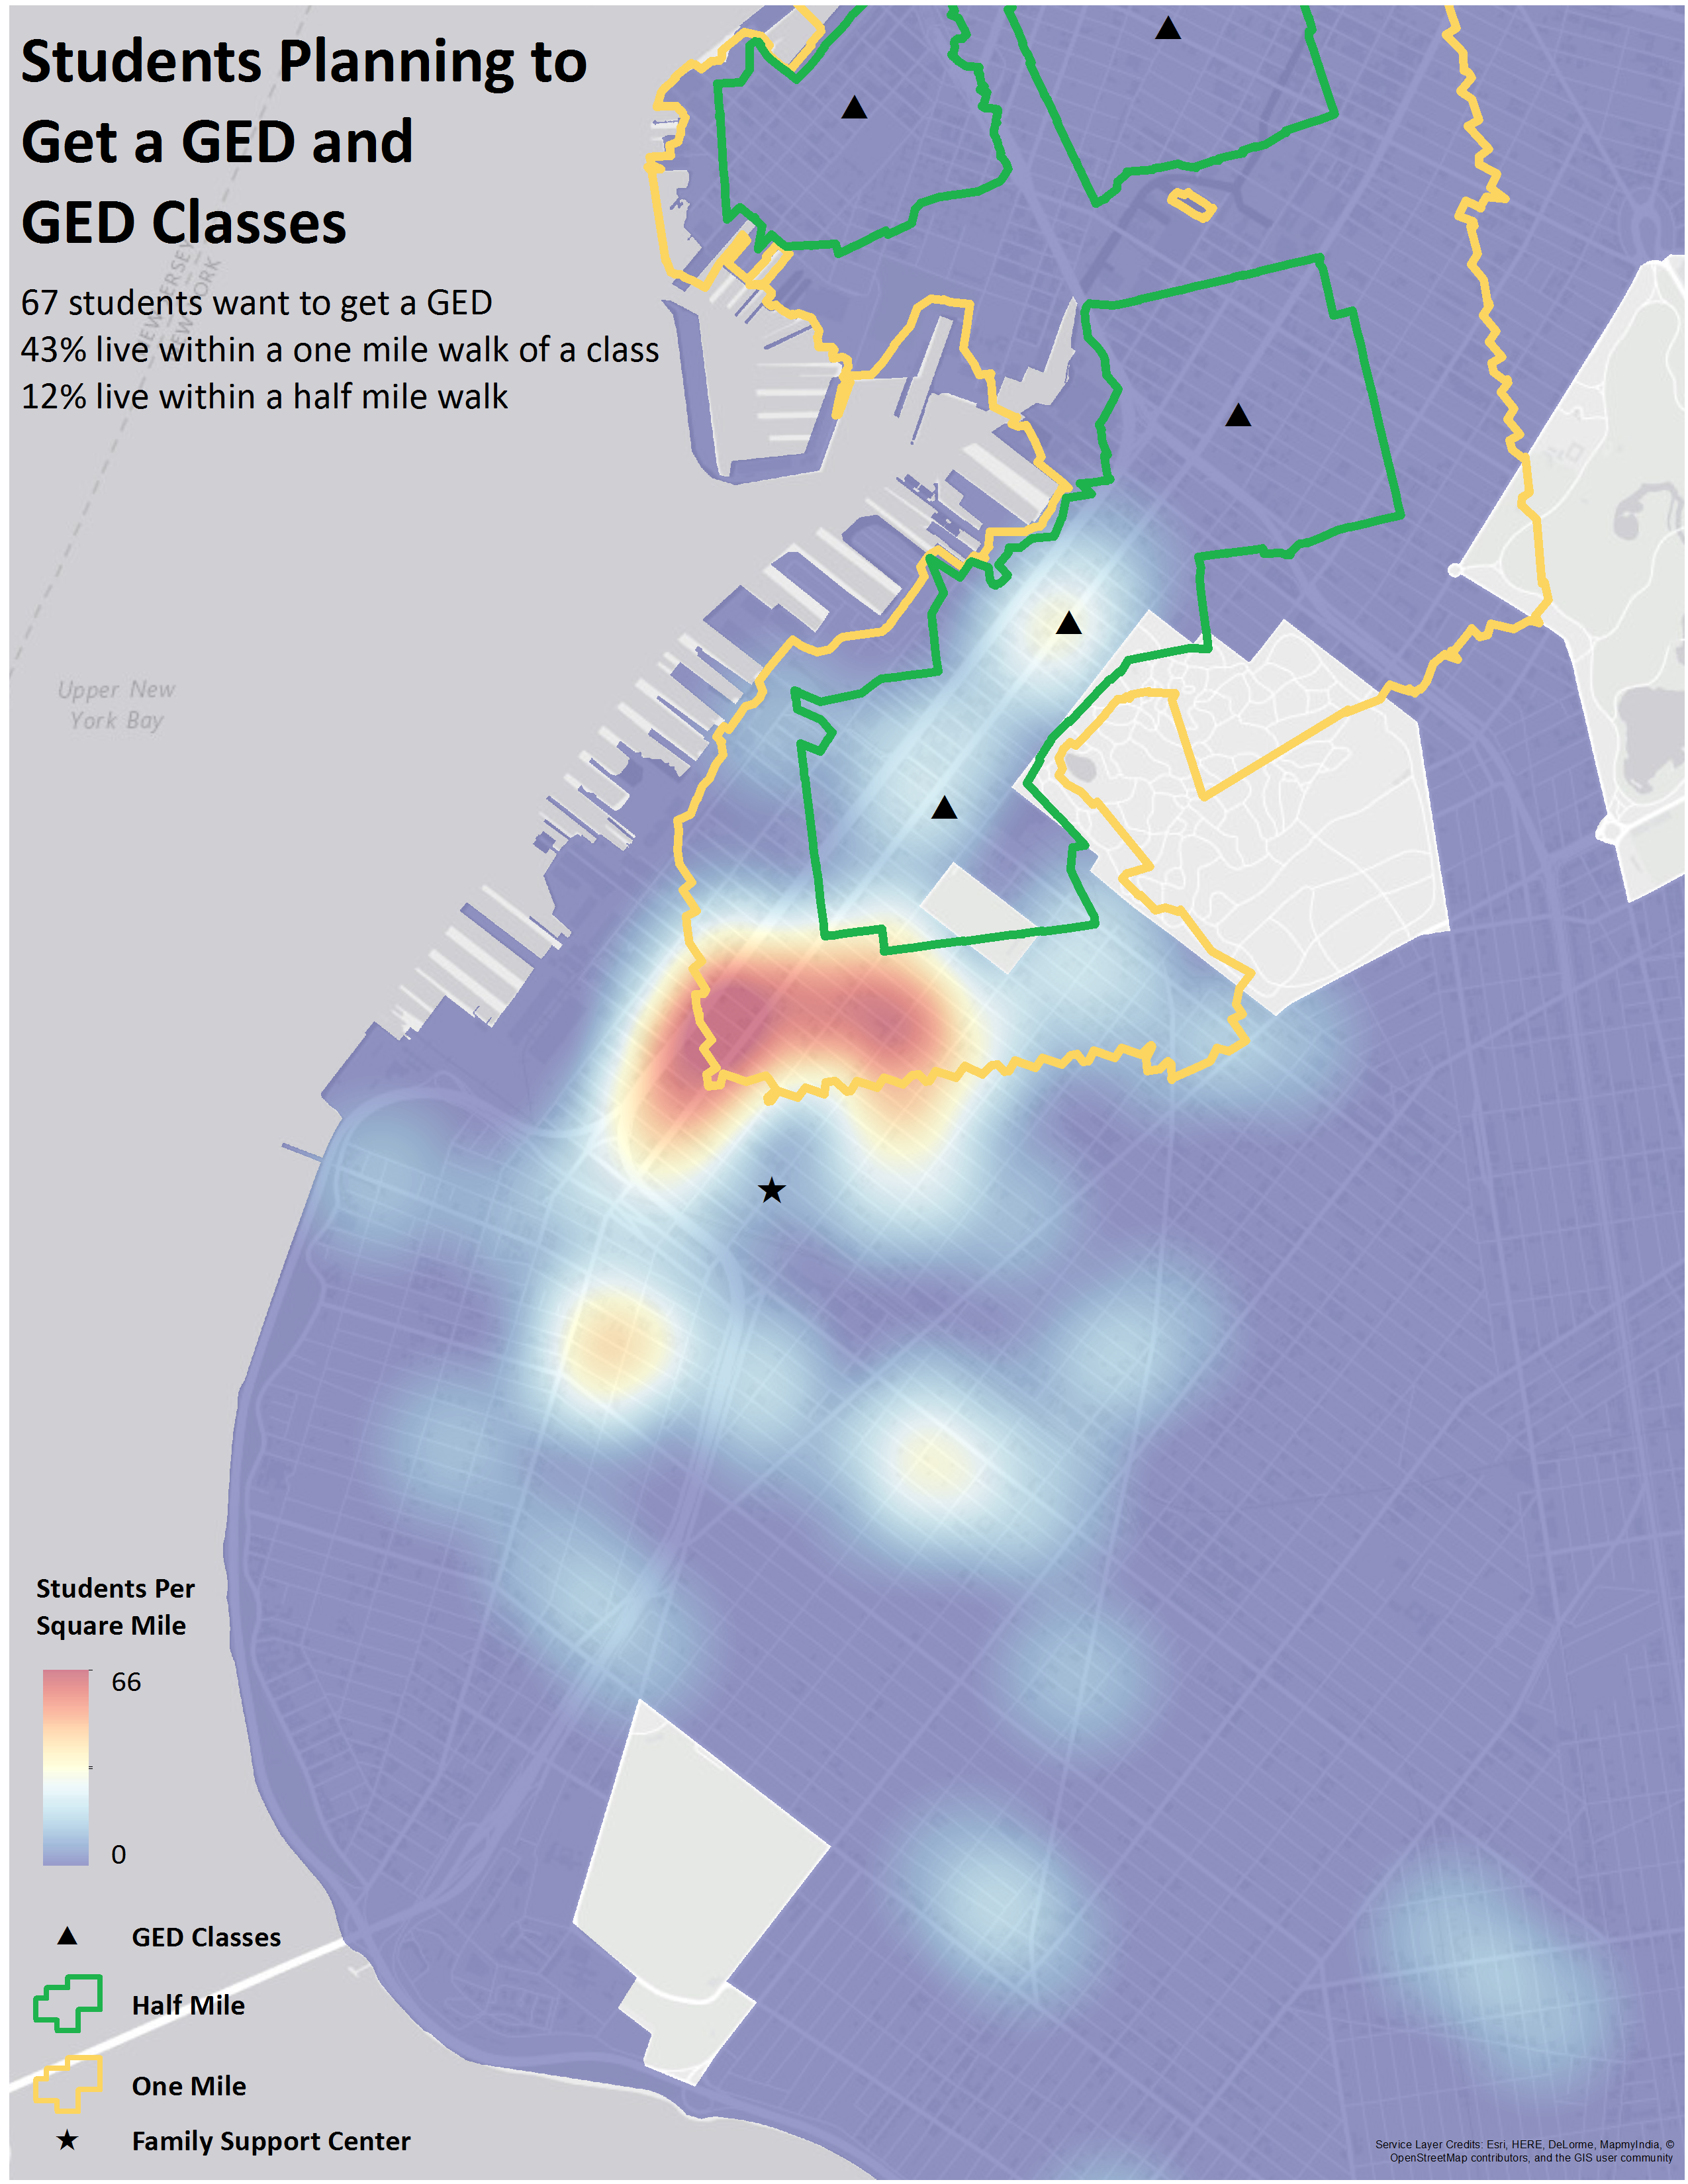
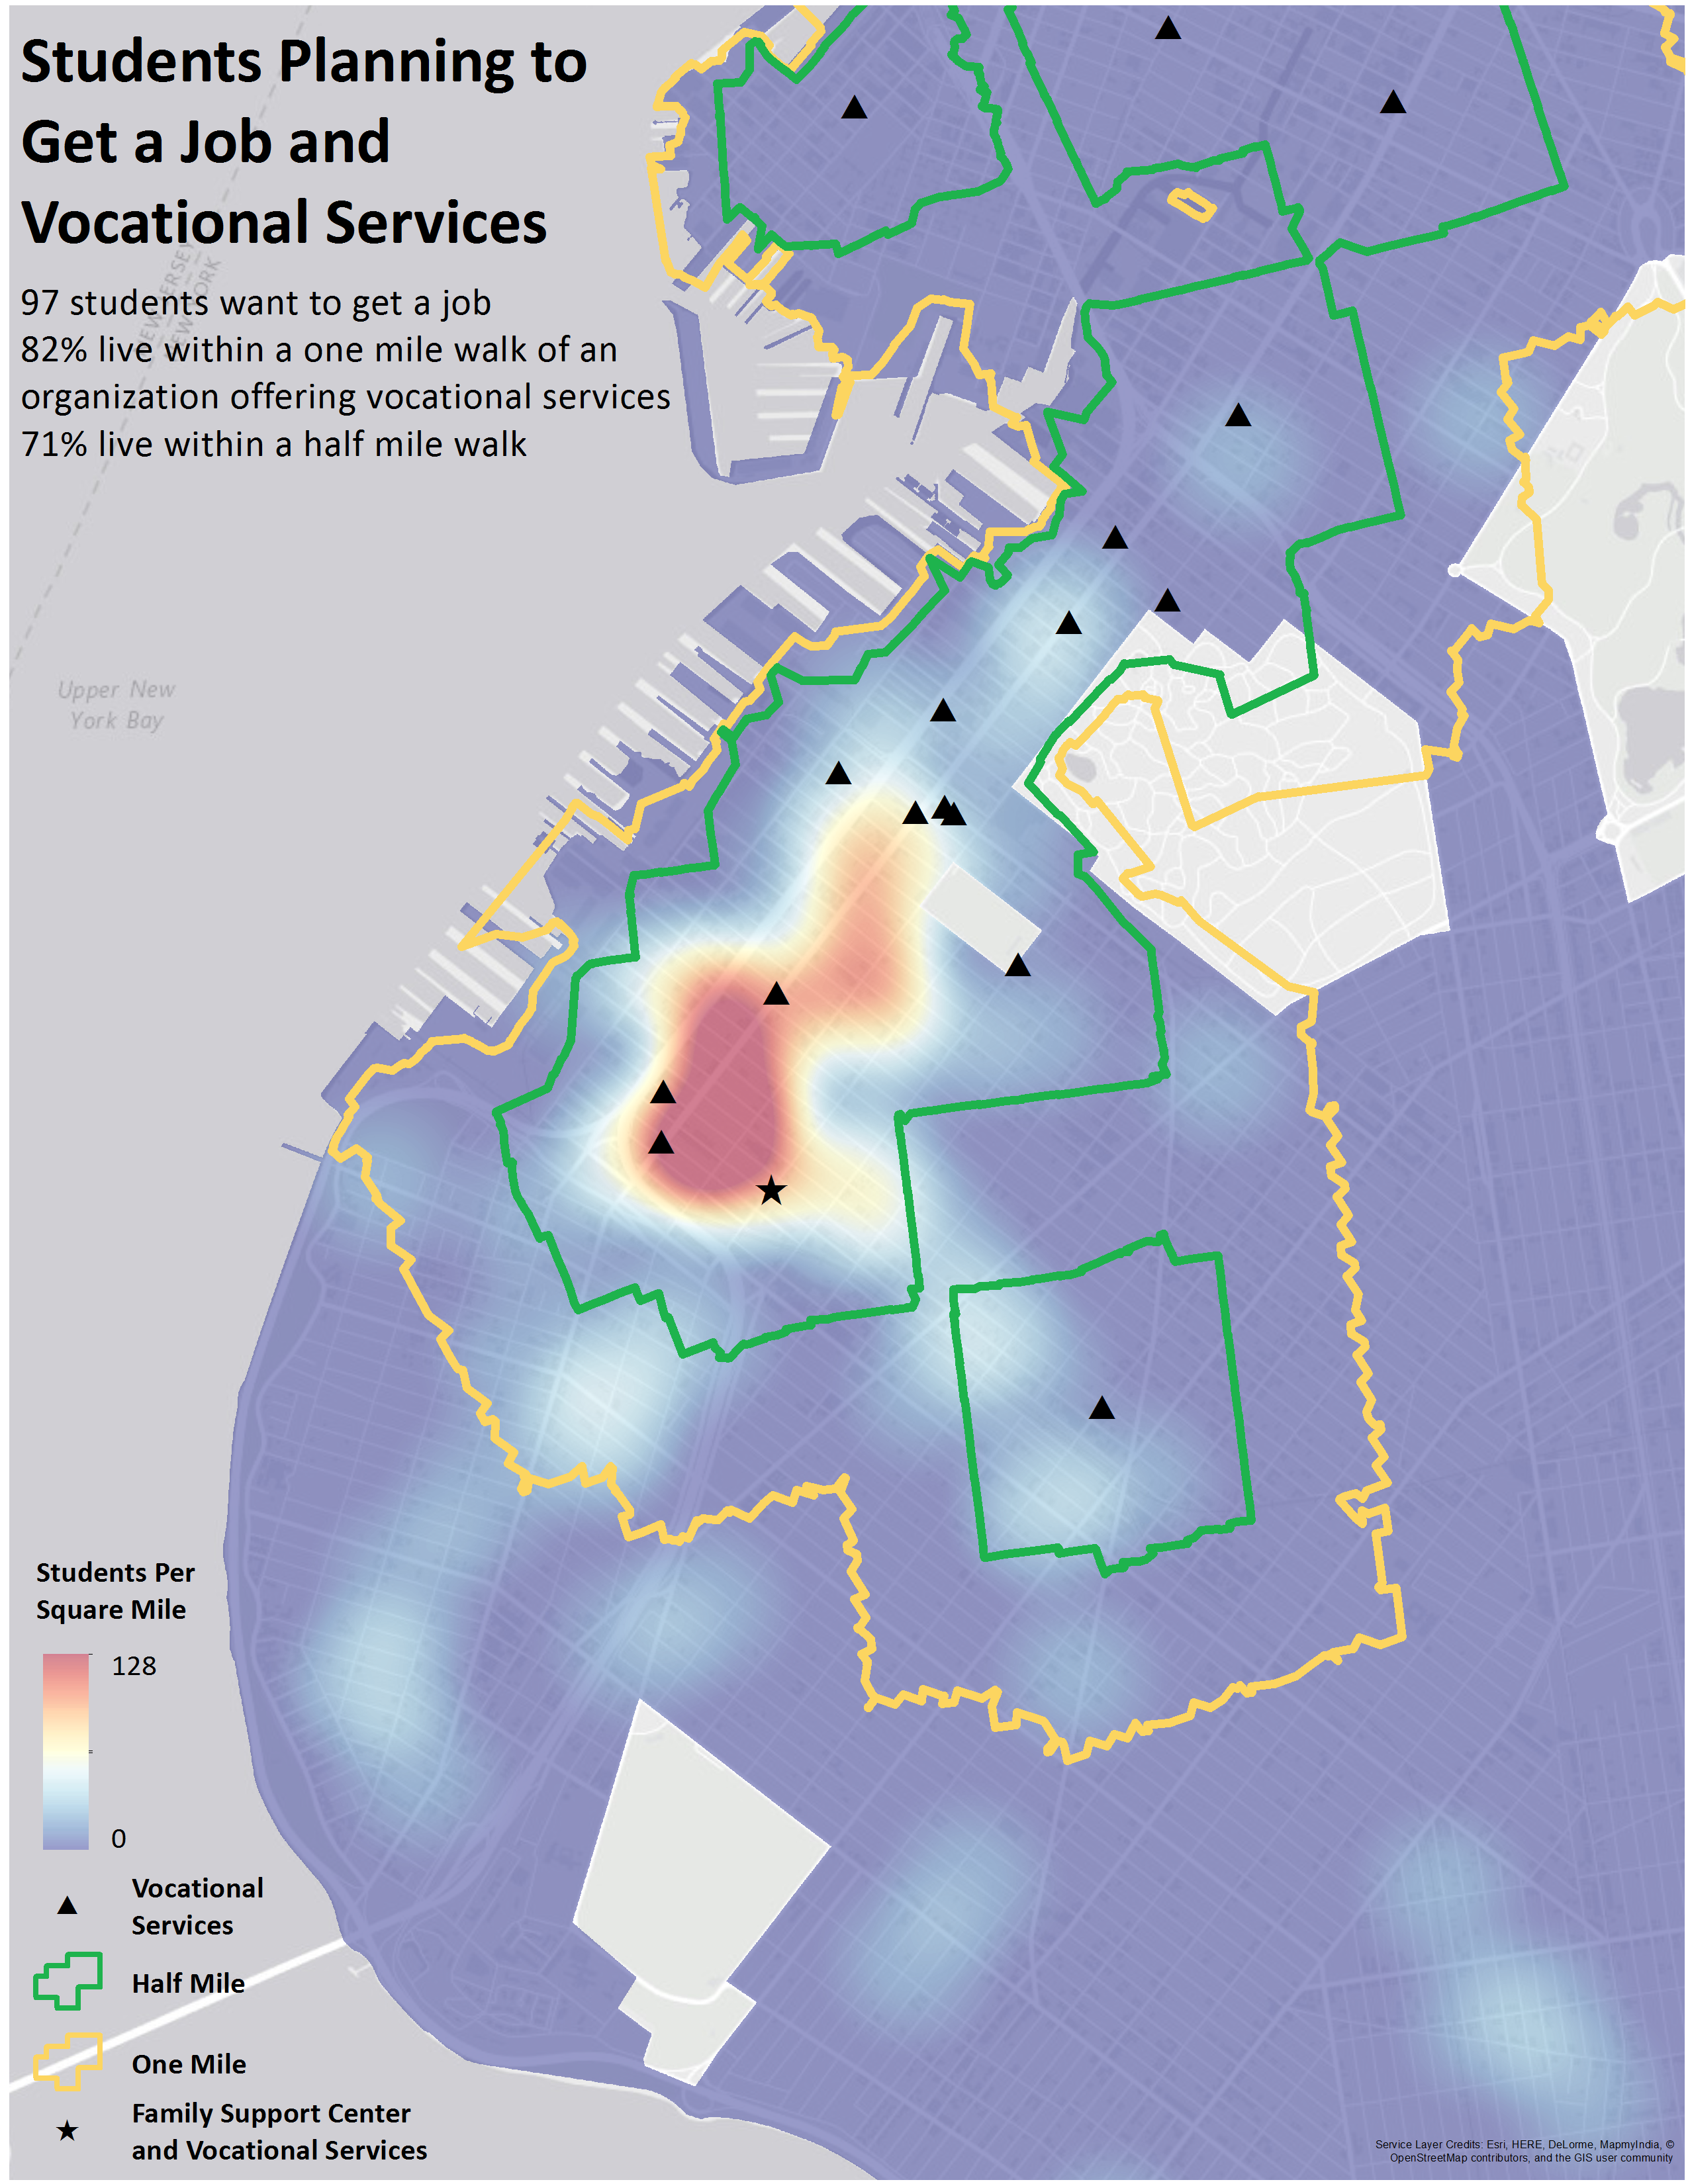
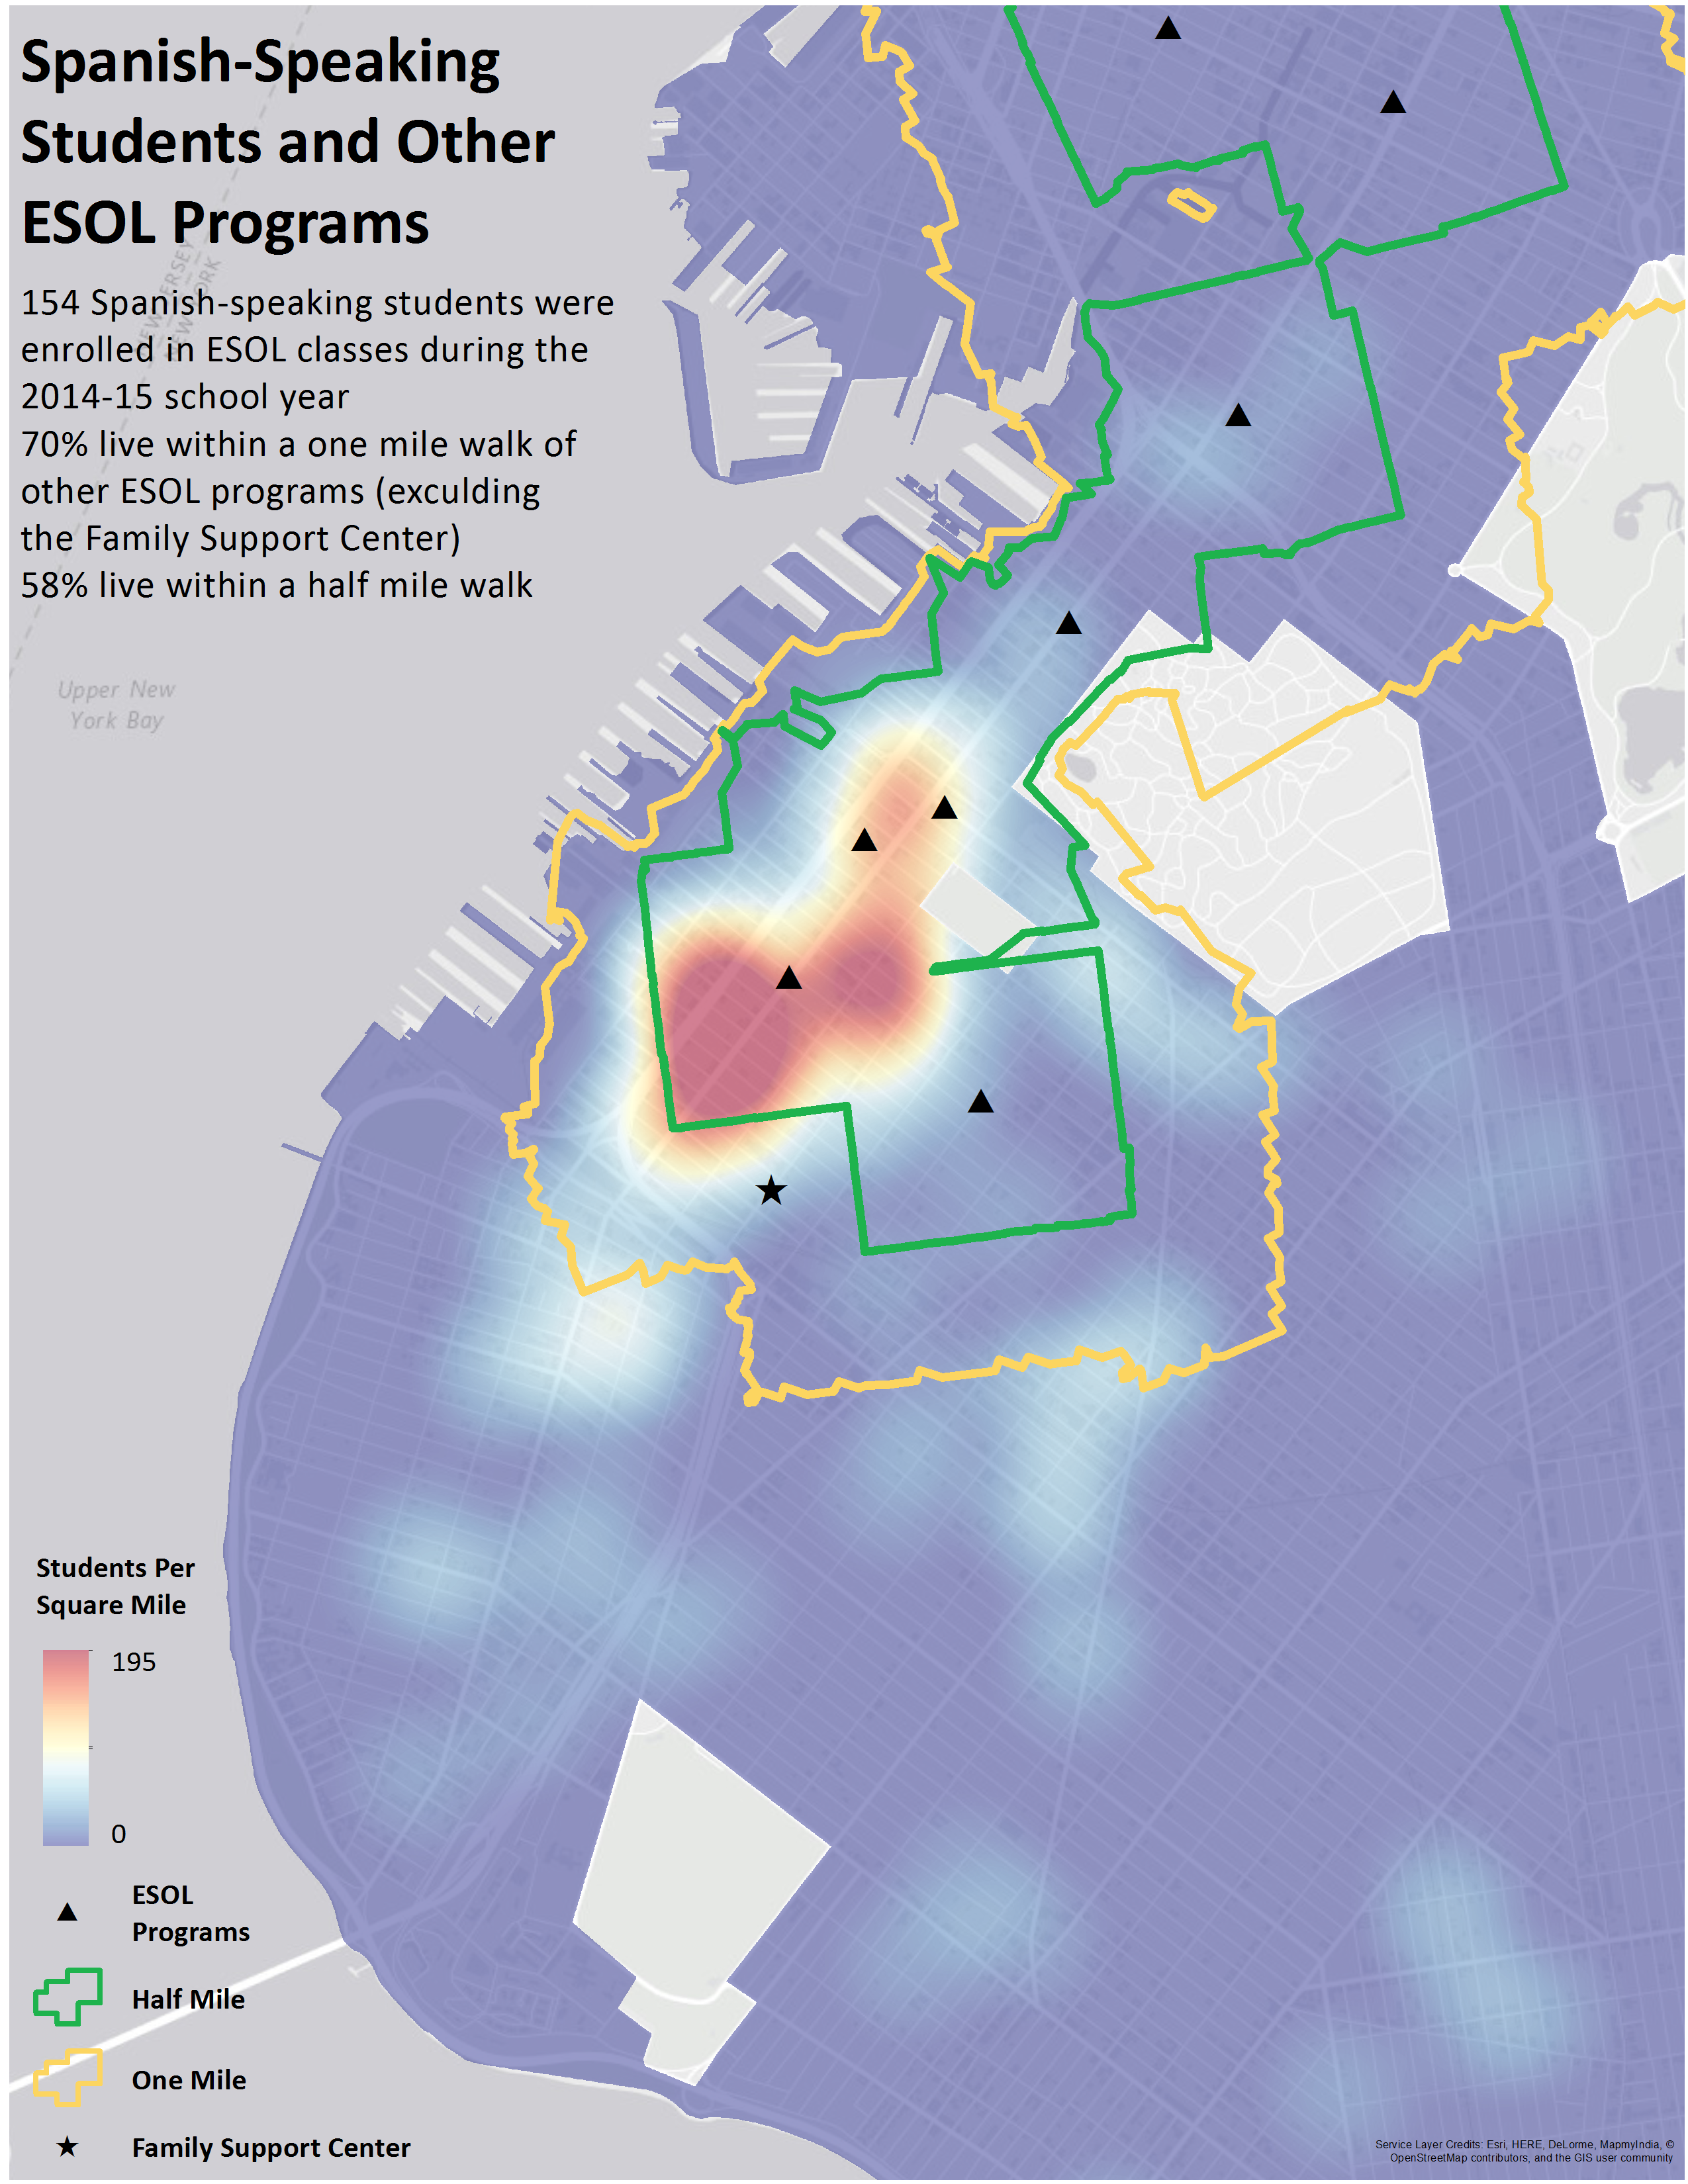
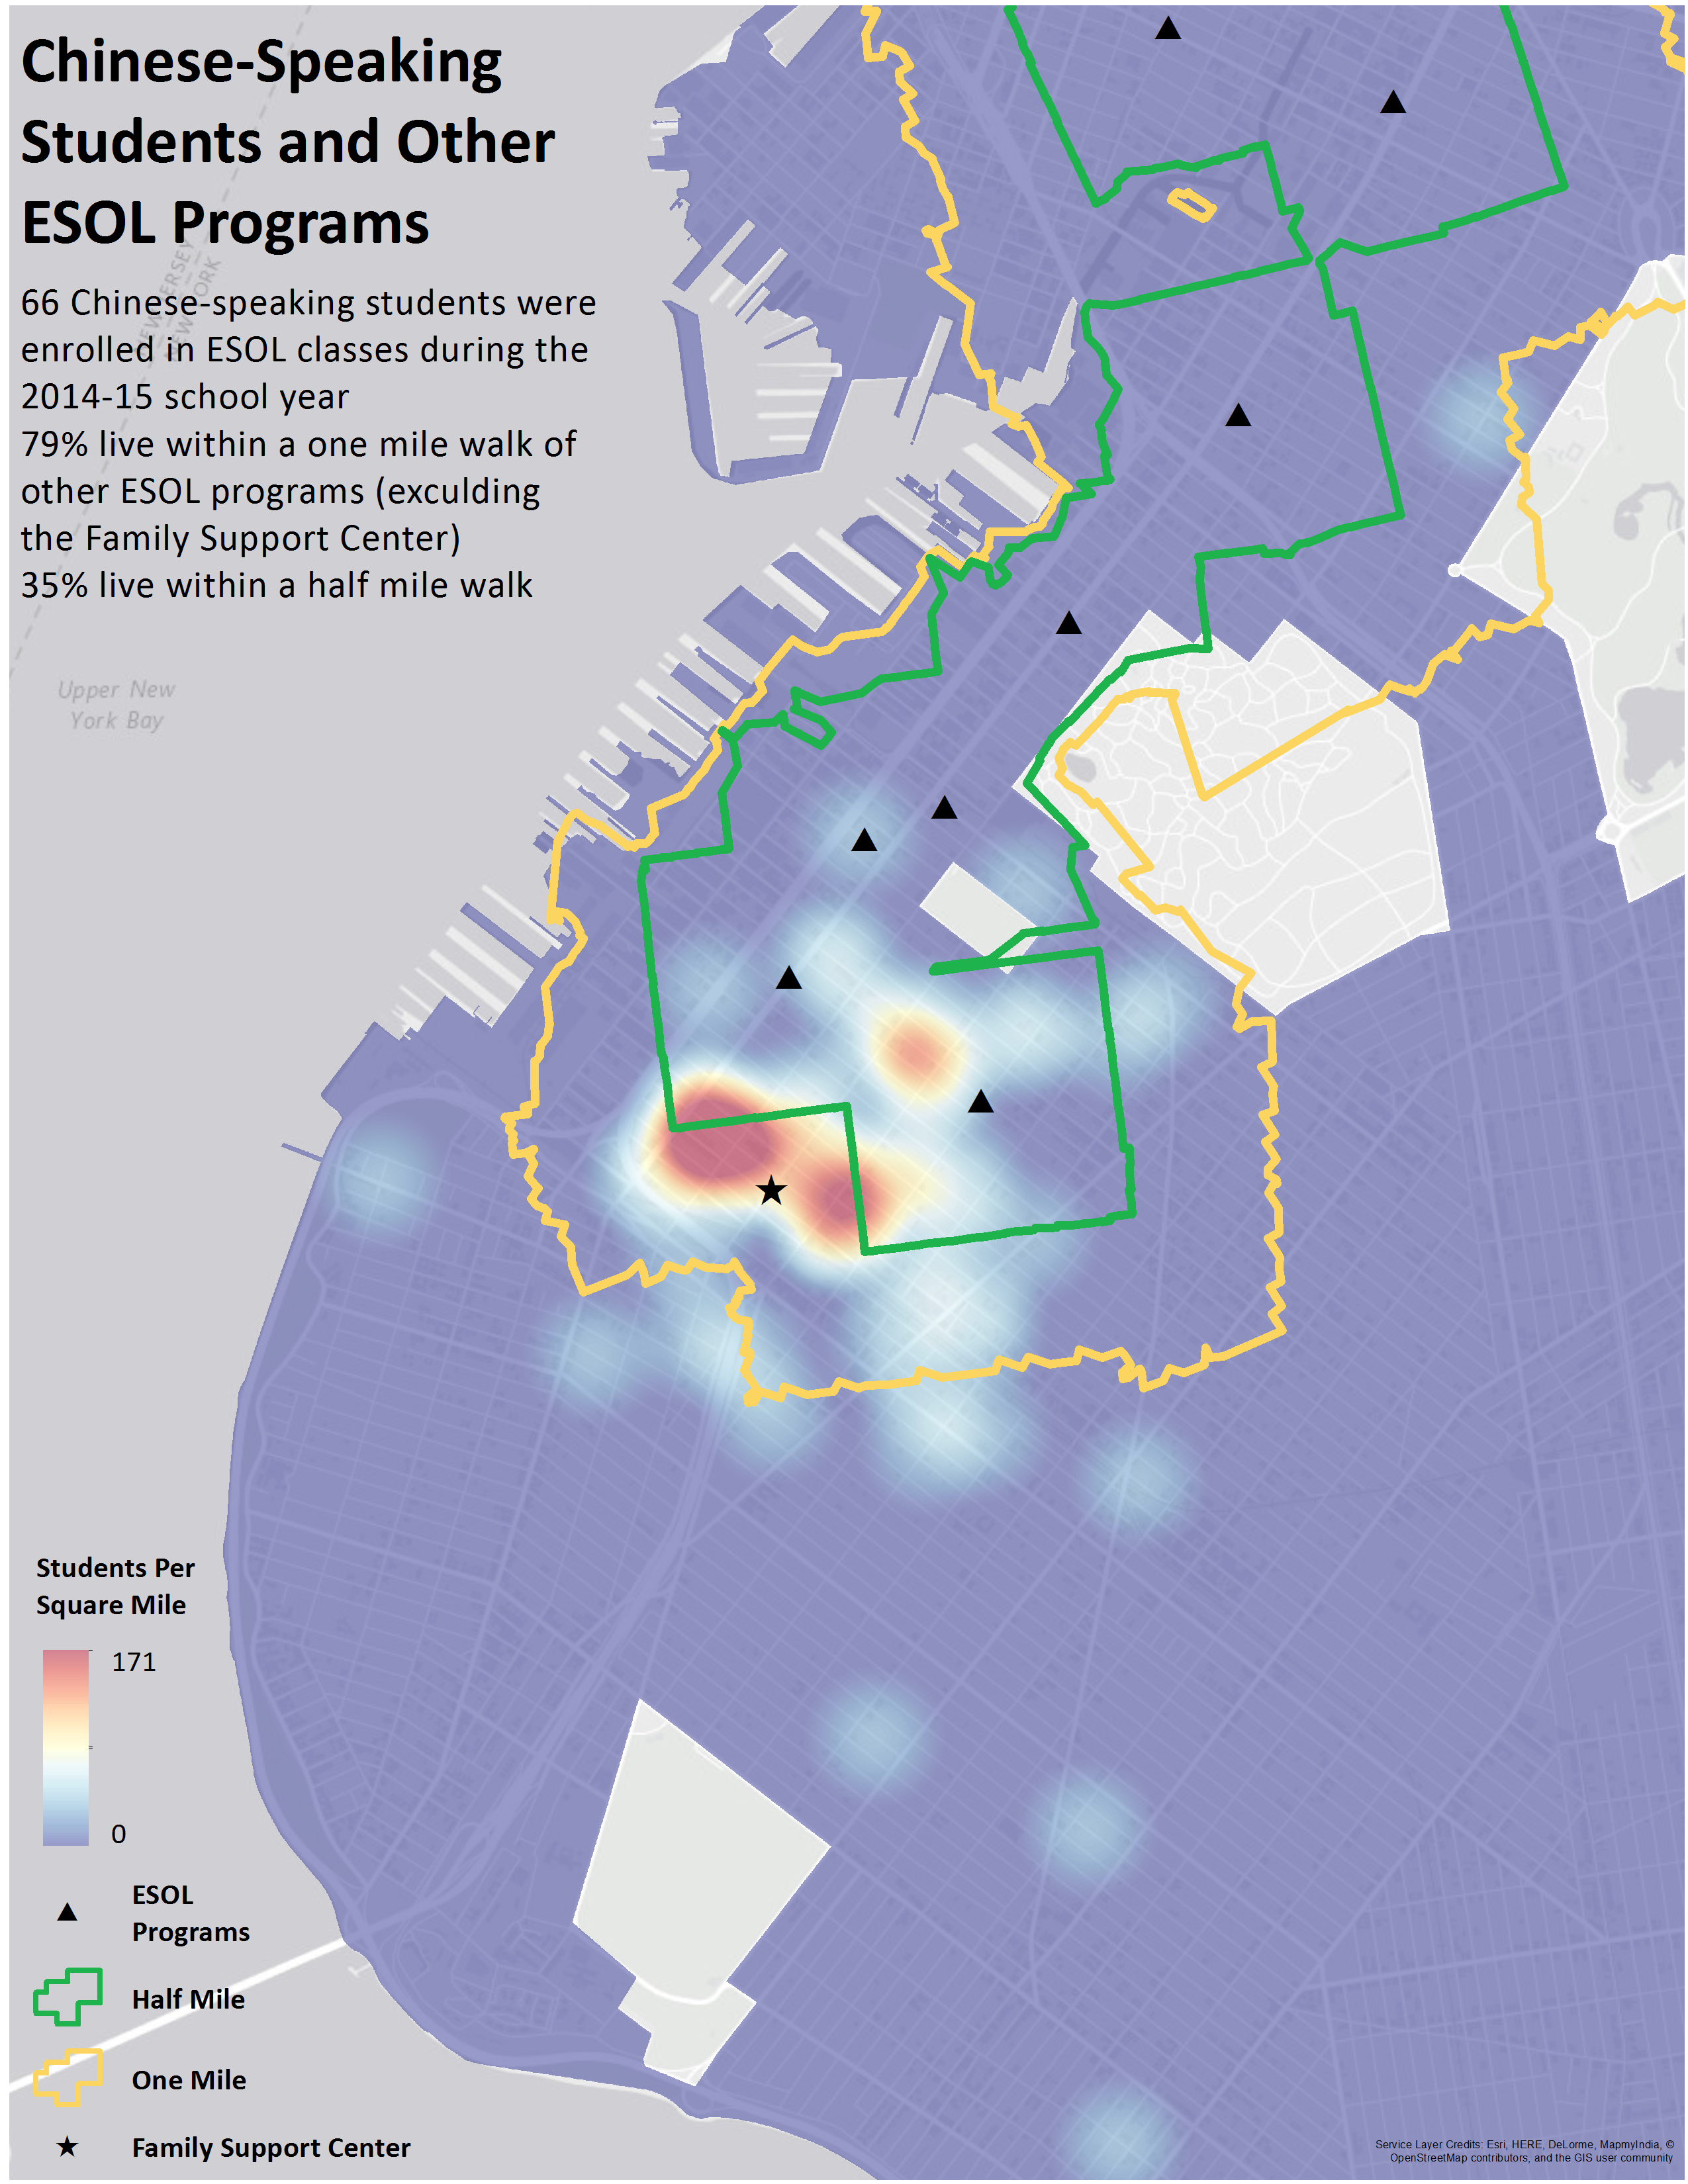
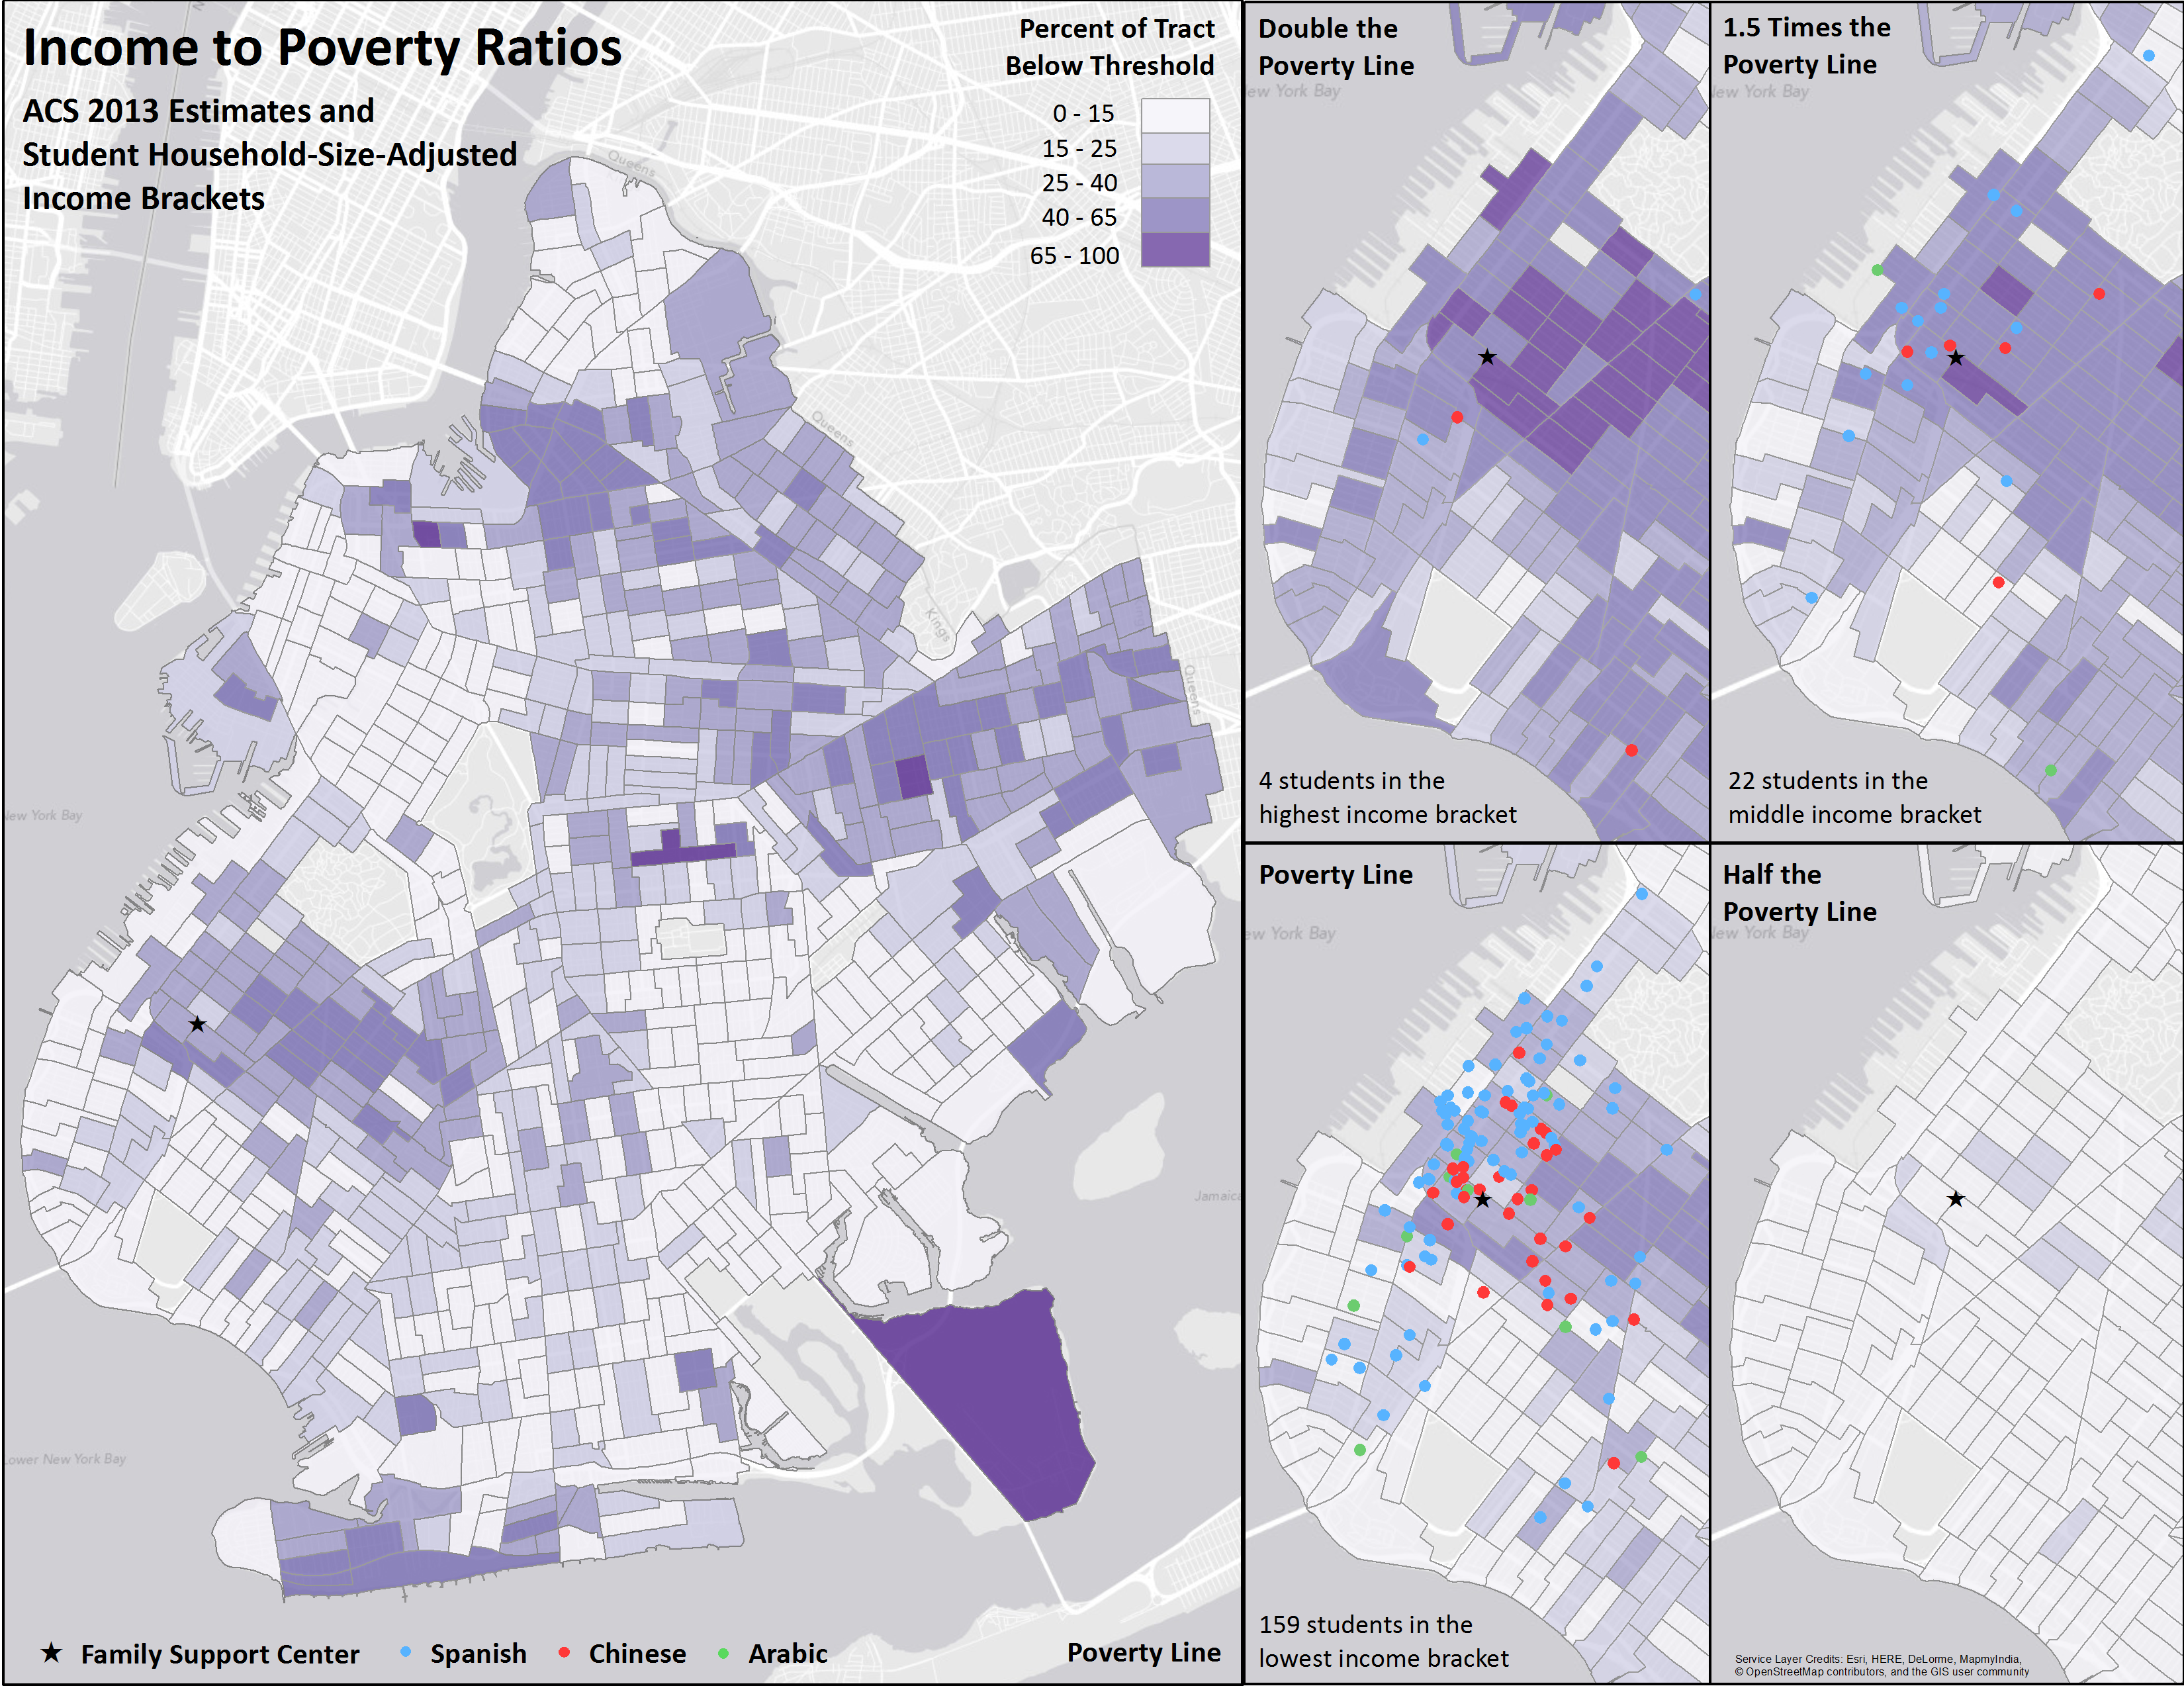
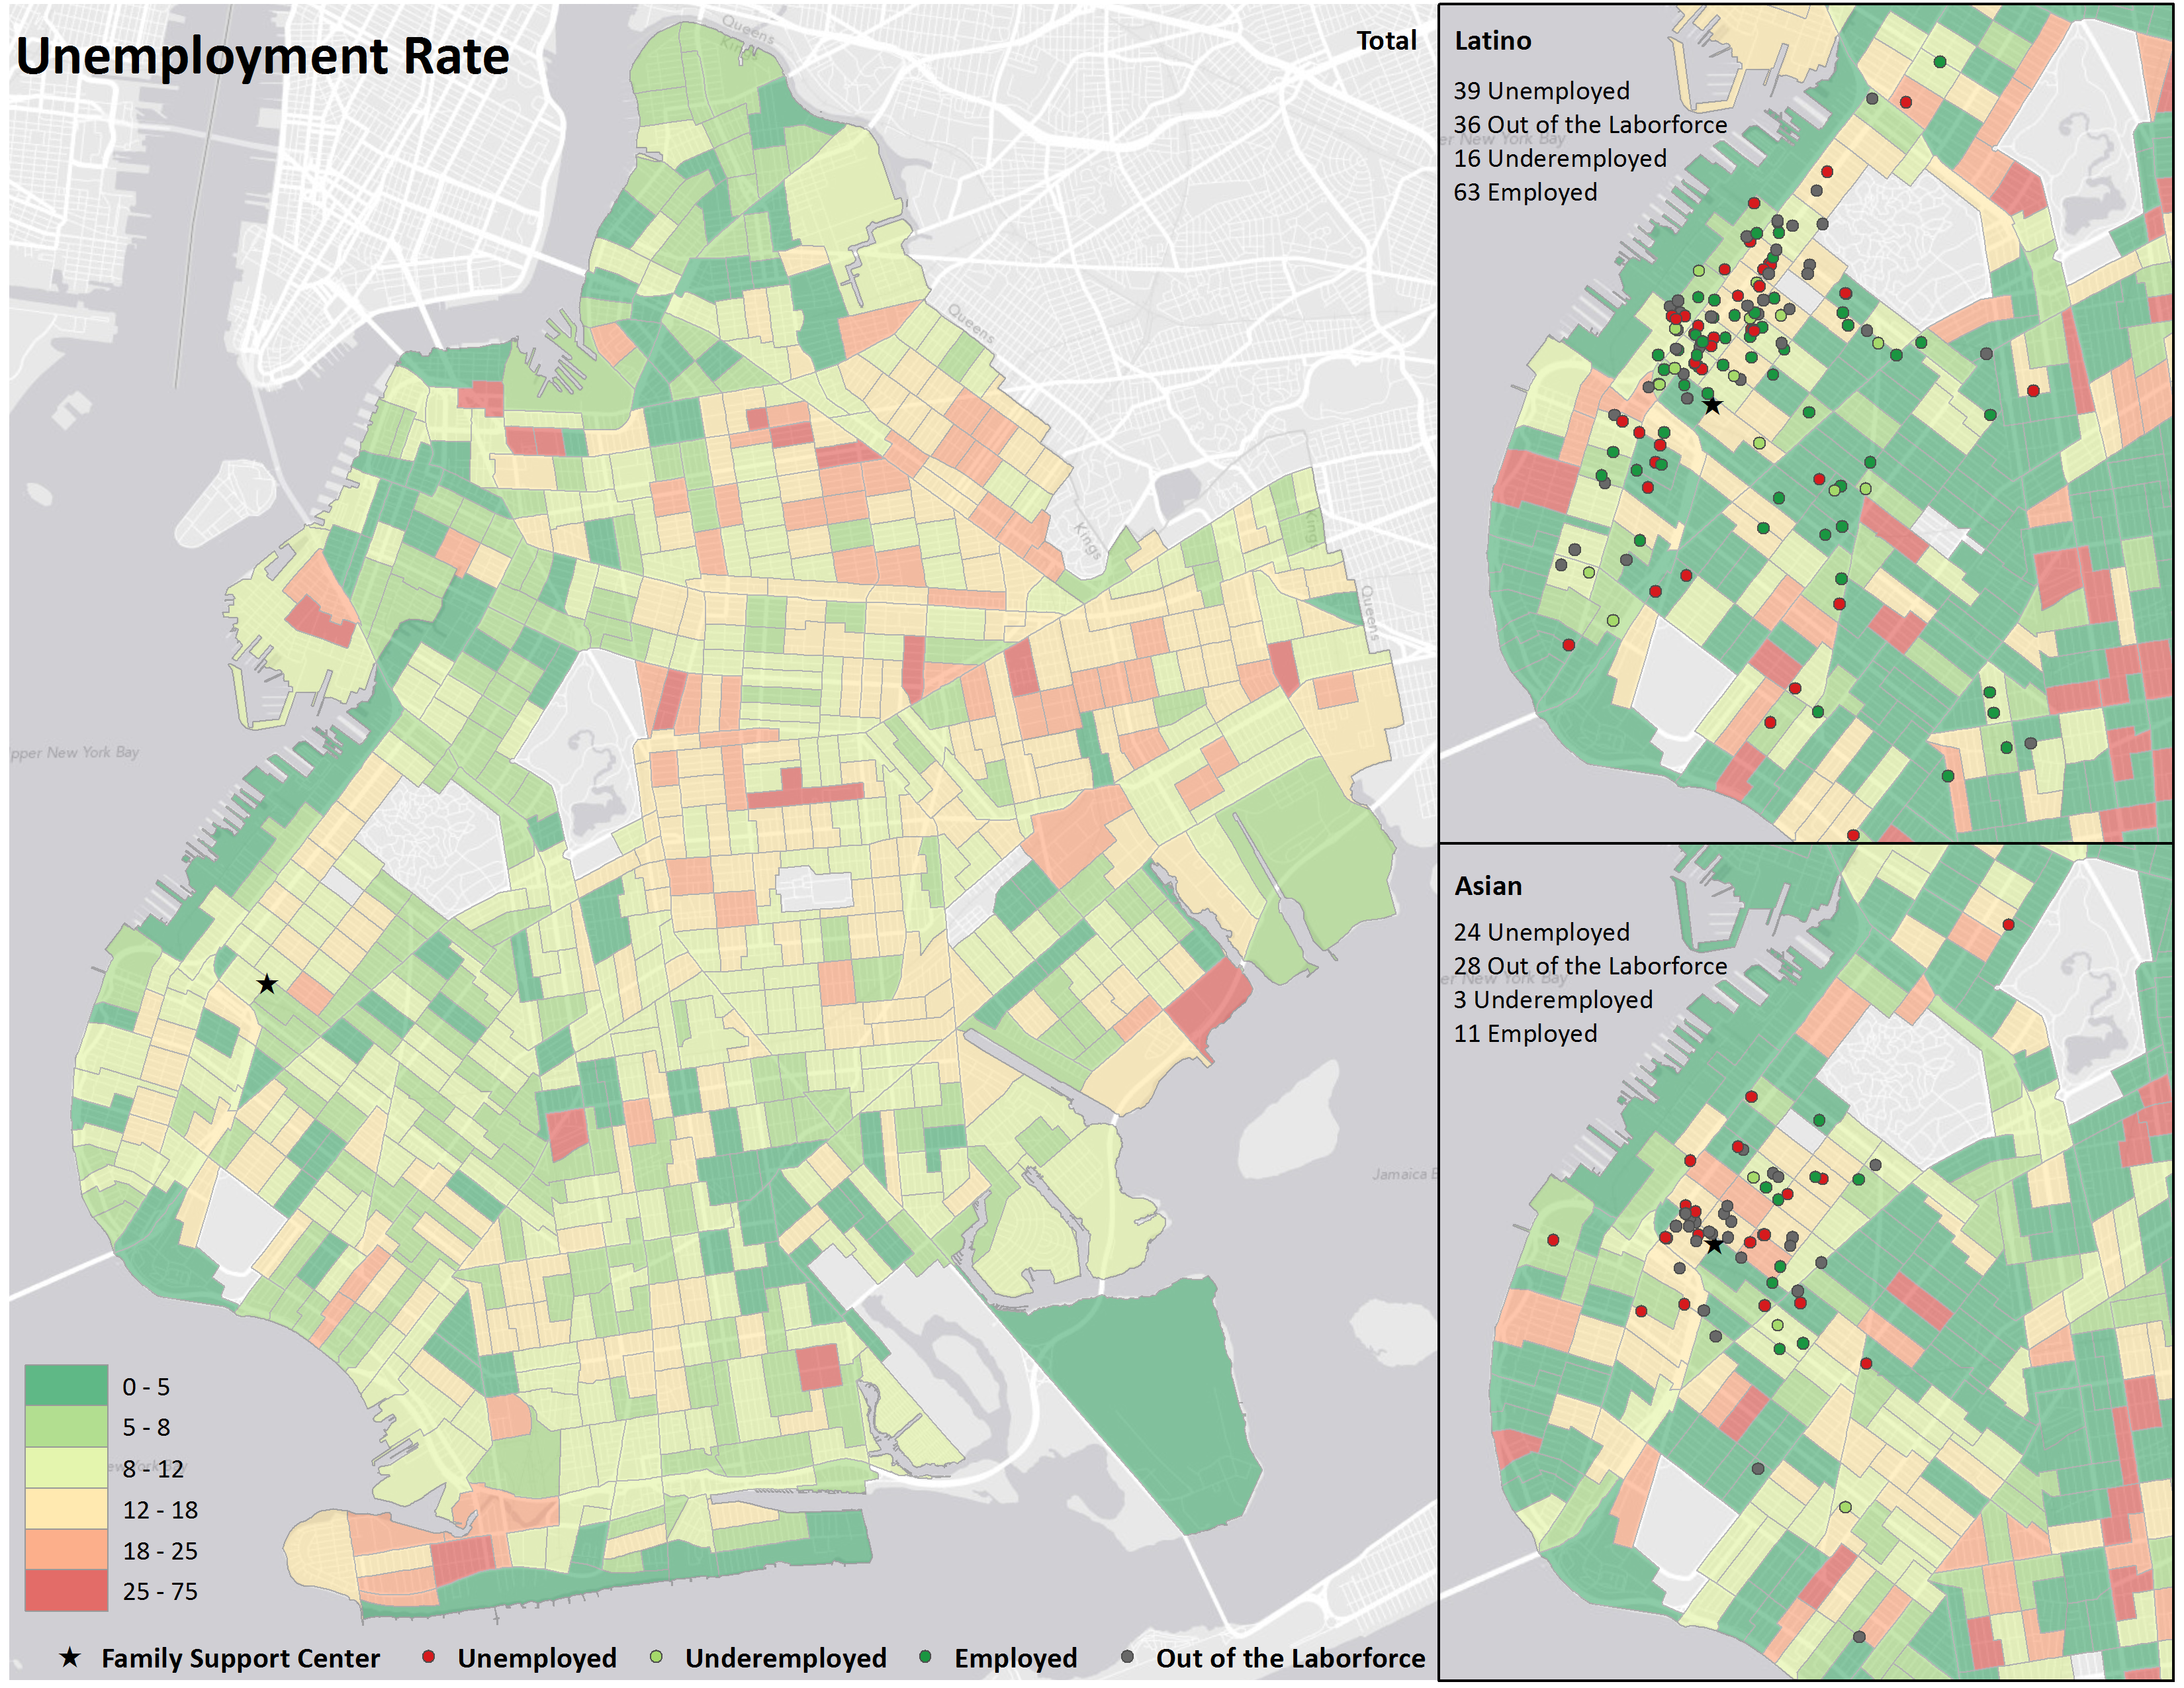
Need vs. Resources Maps
Part of a series of maps identifying the density of ESOL students with a particular need and walking distances to organizations offering related services. This work was completed through the Summer of Maps program at Azavea. Read more about the project here.
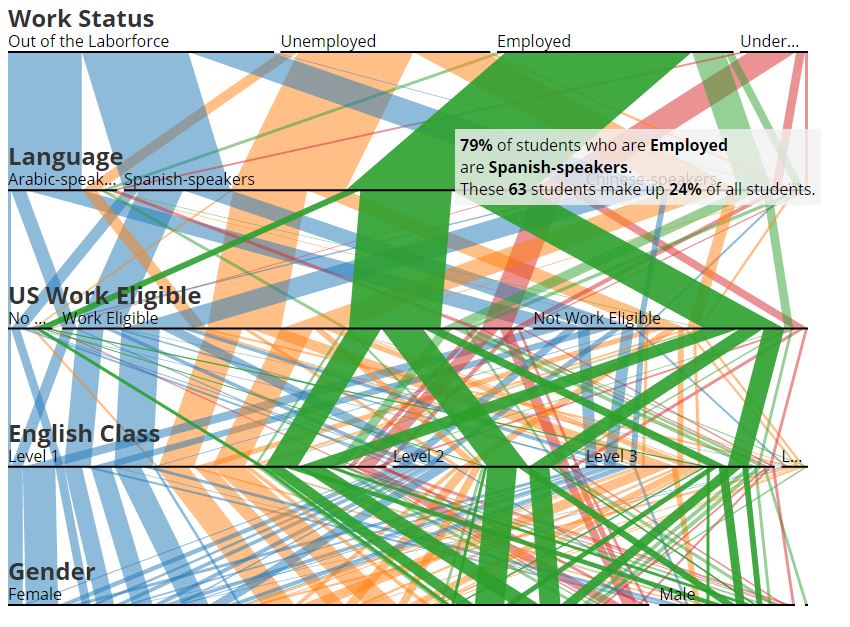
D3 Parallel Sets Tool
A tool for exploring the demographics of a population, in this case a group of ESOL students. Modified from Jason Davies’ d3.parsets.
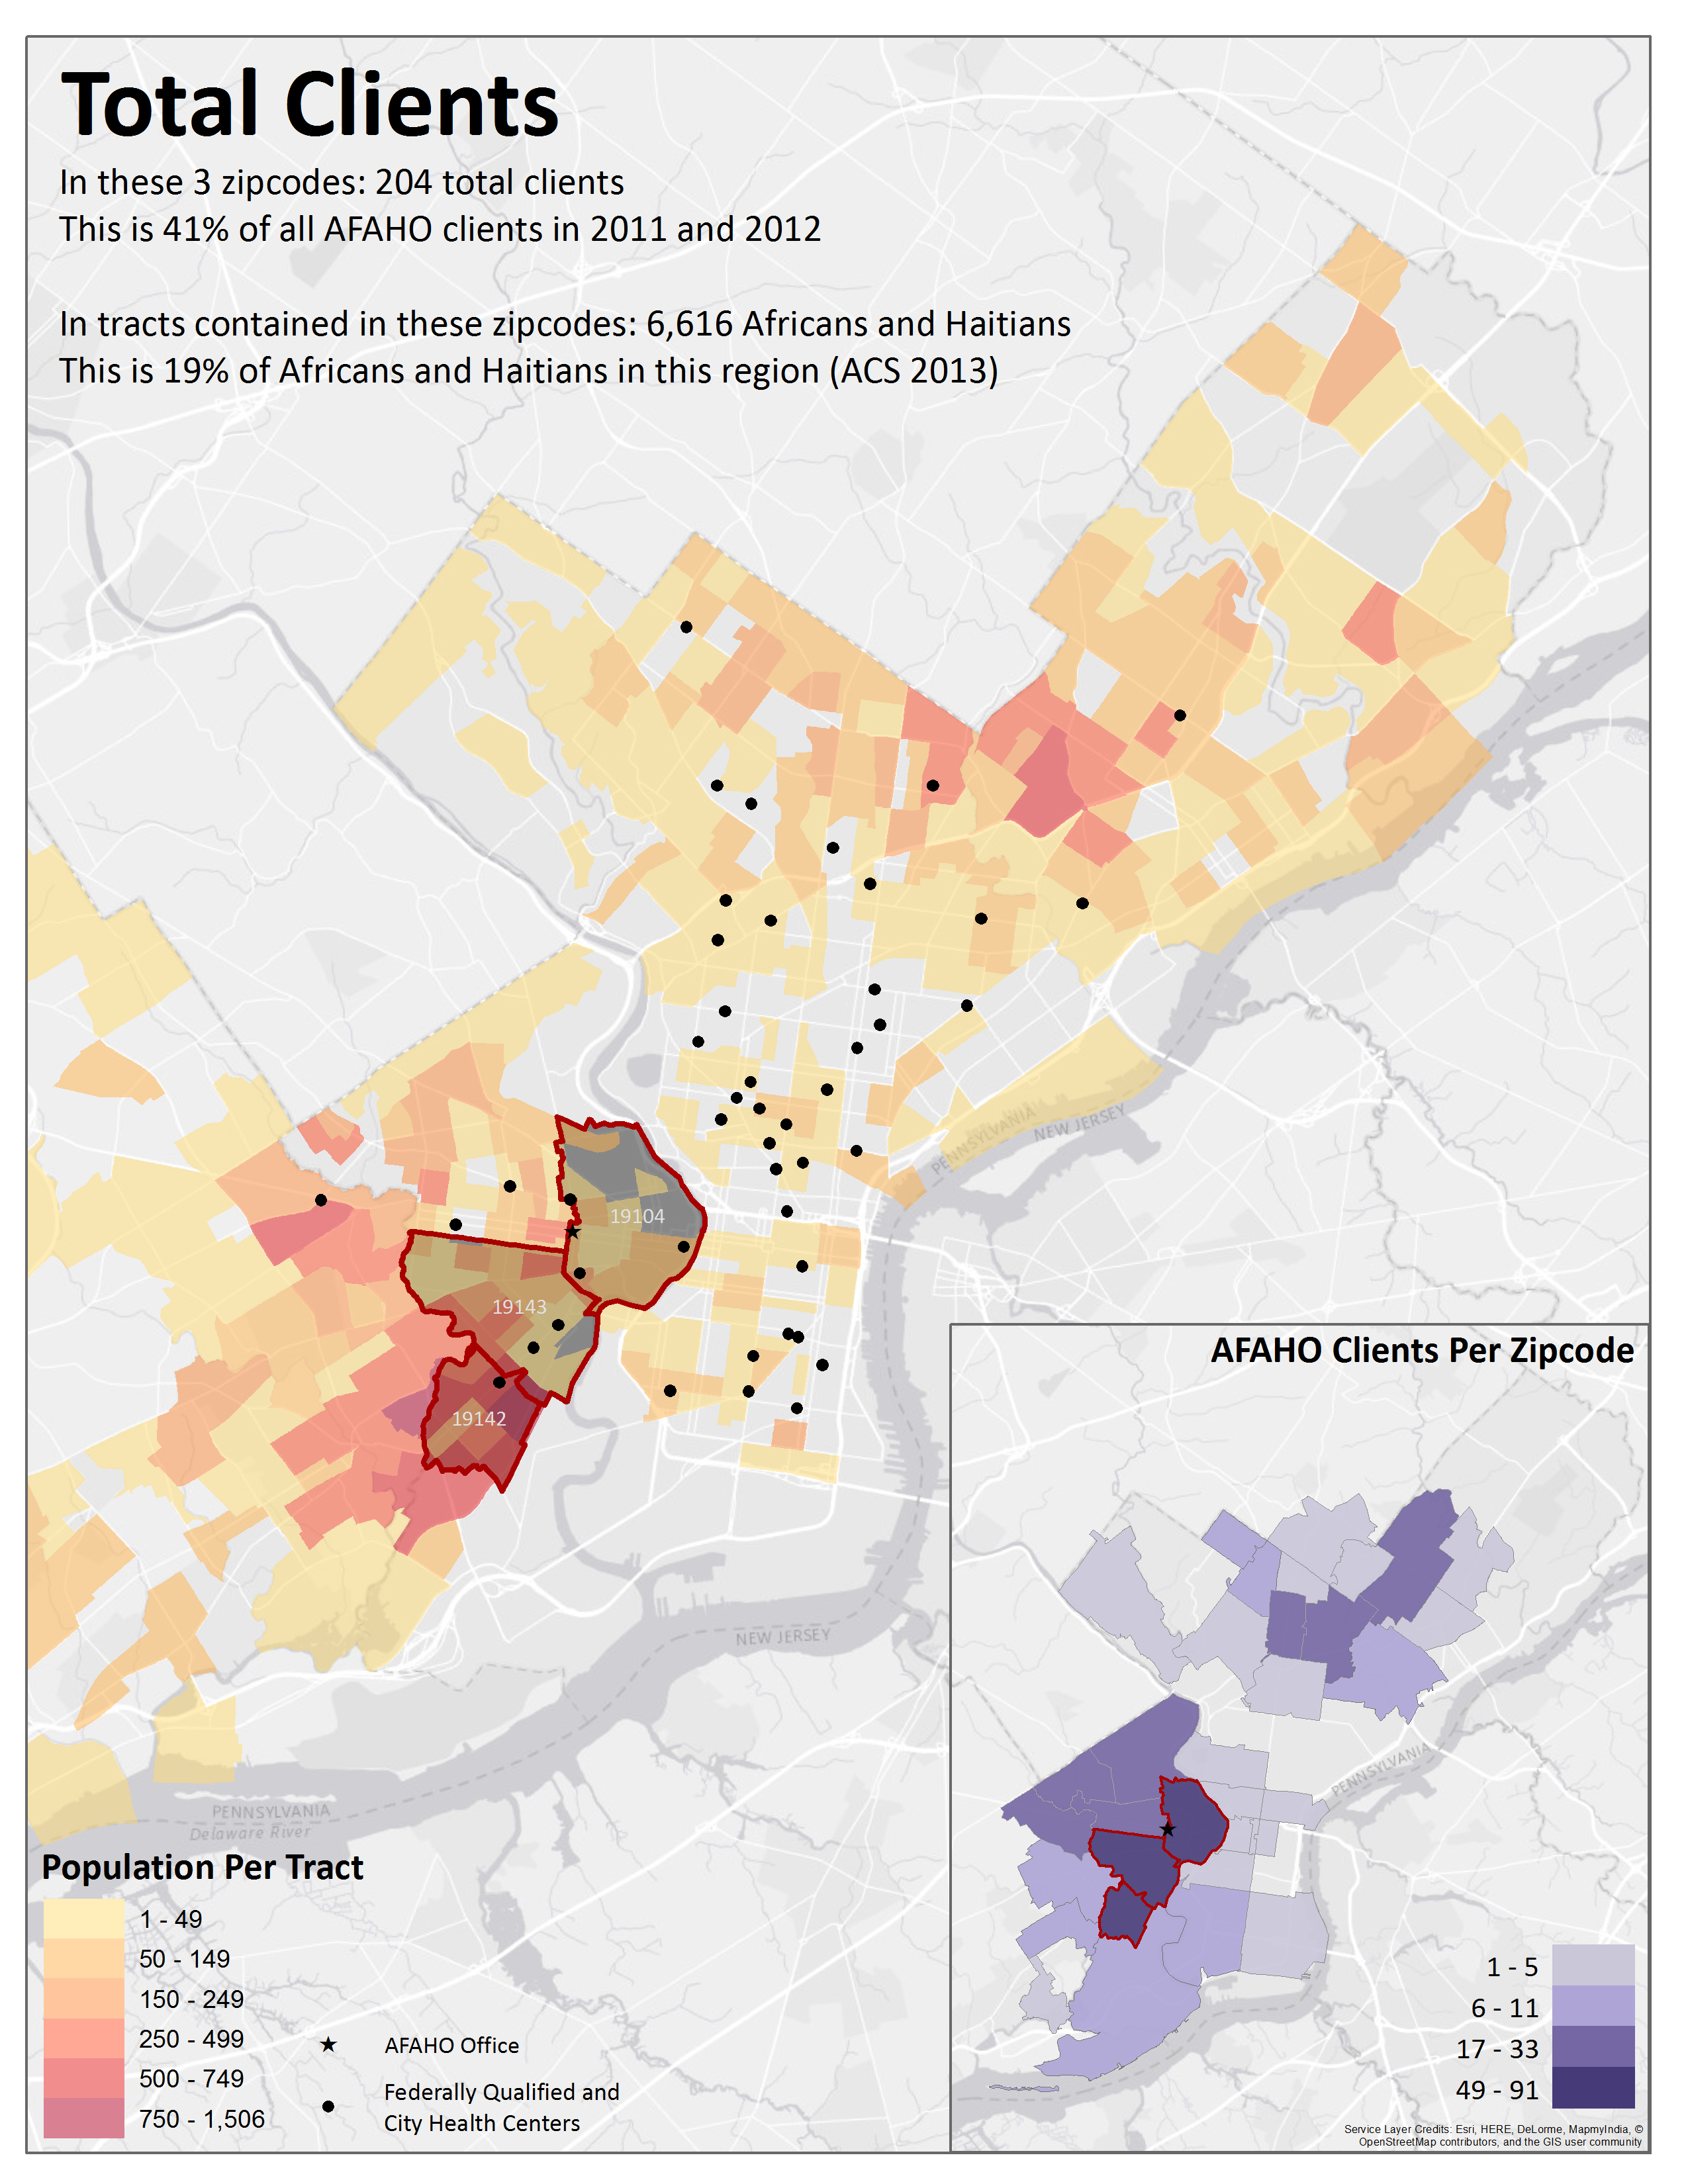
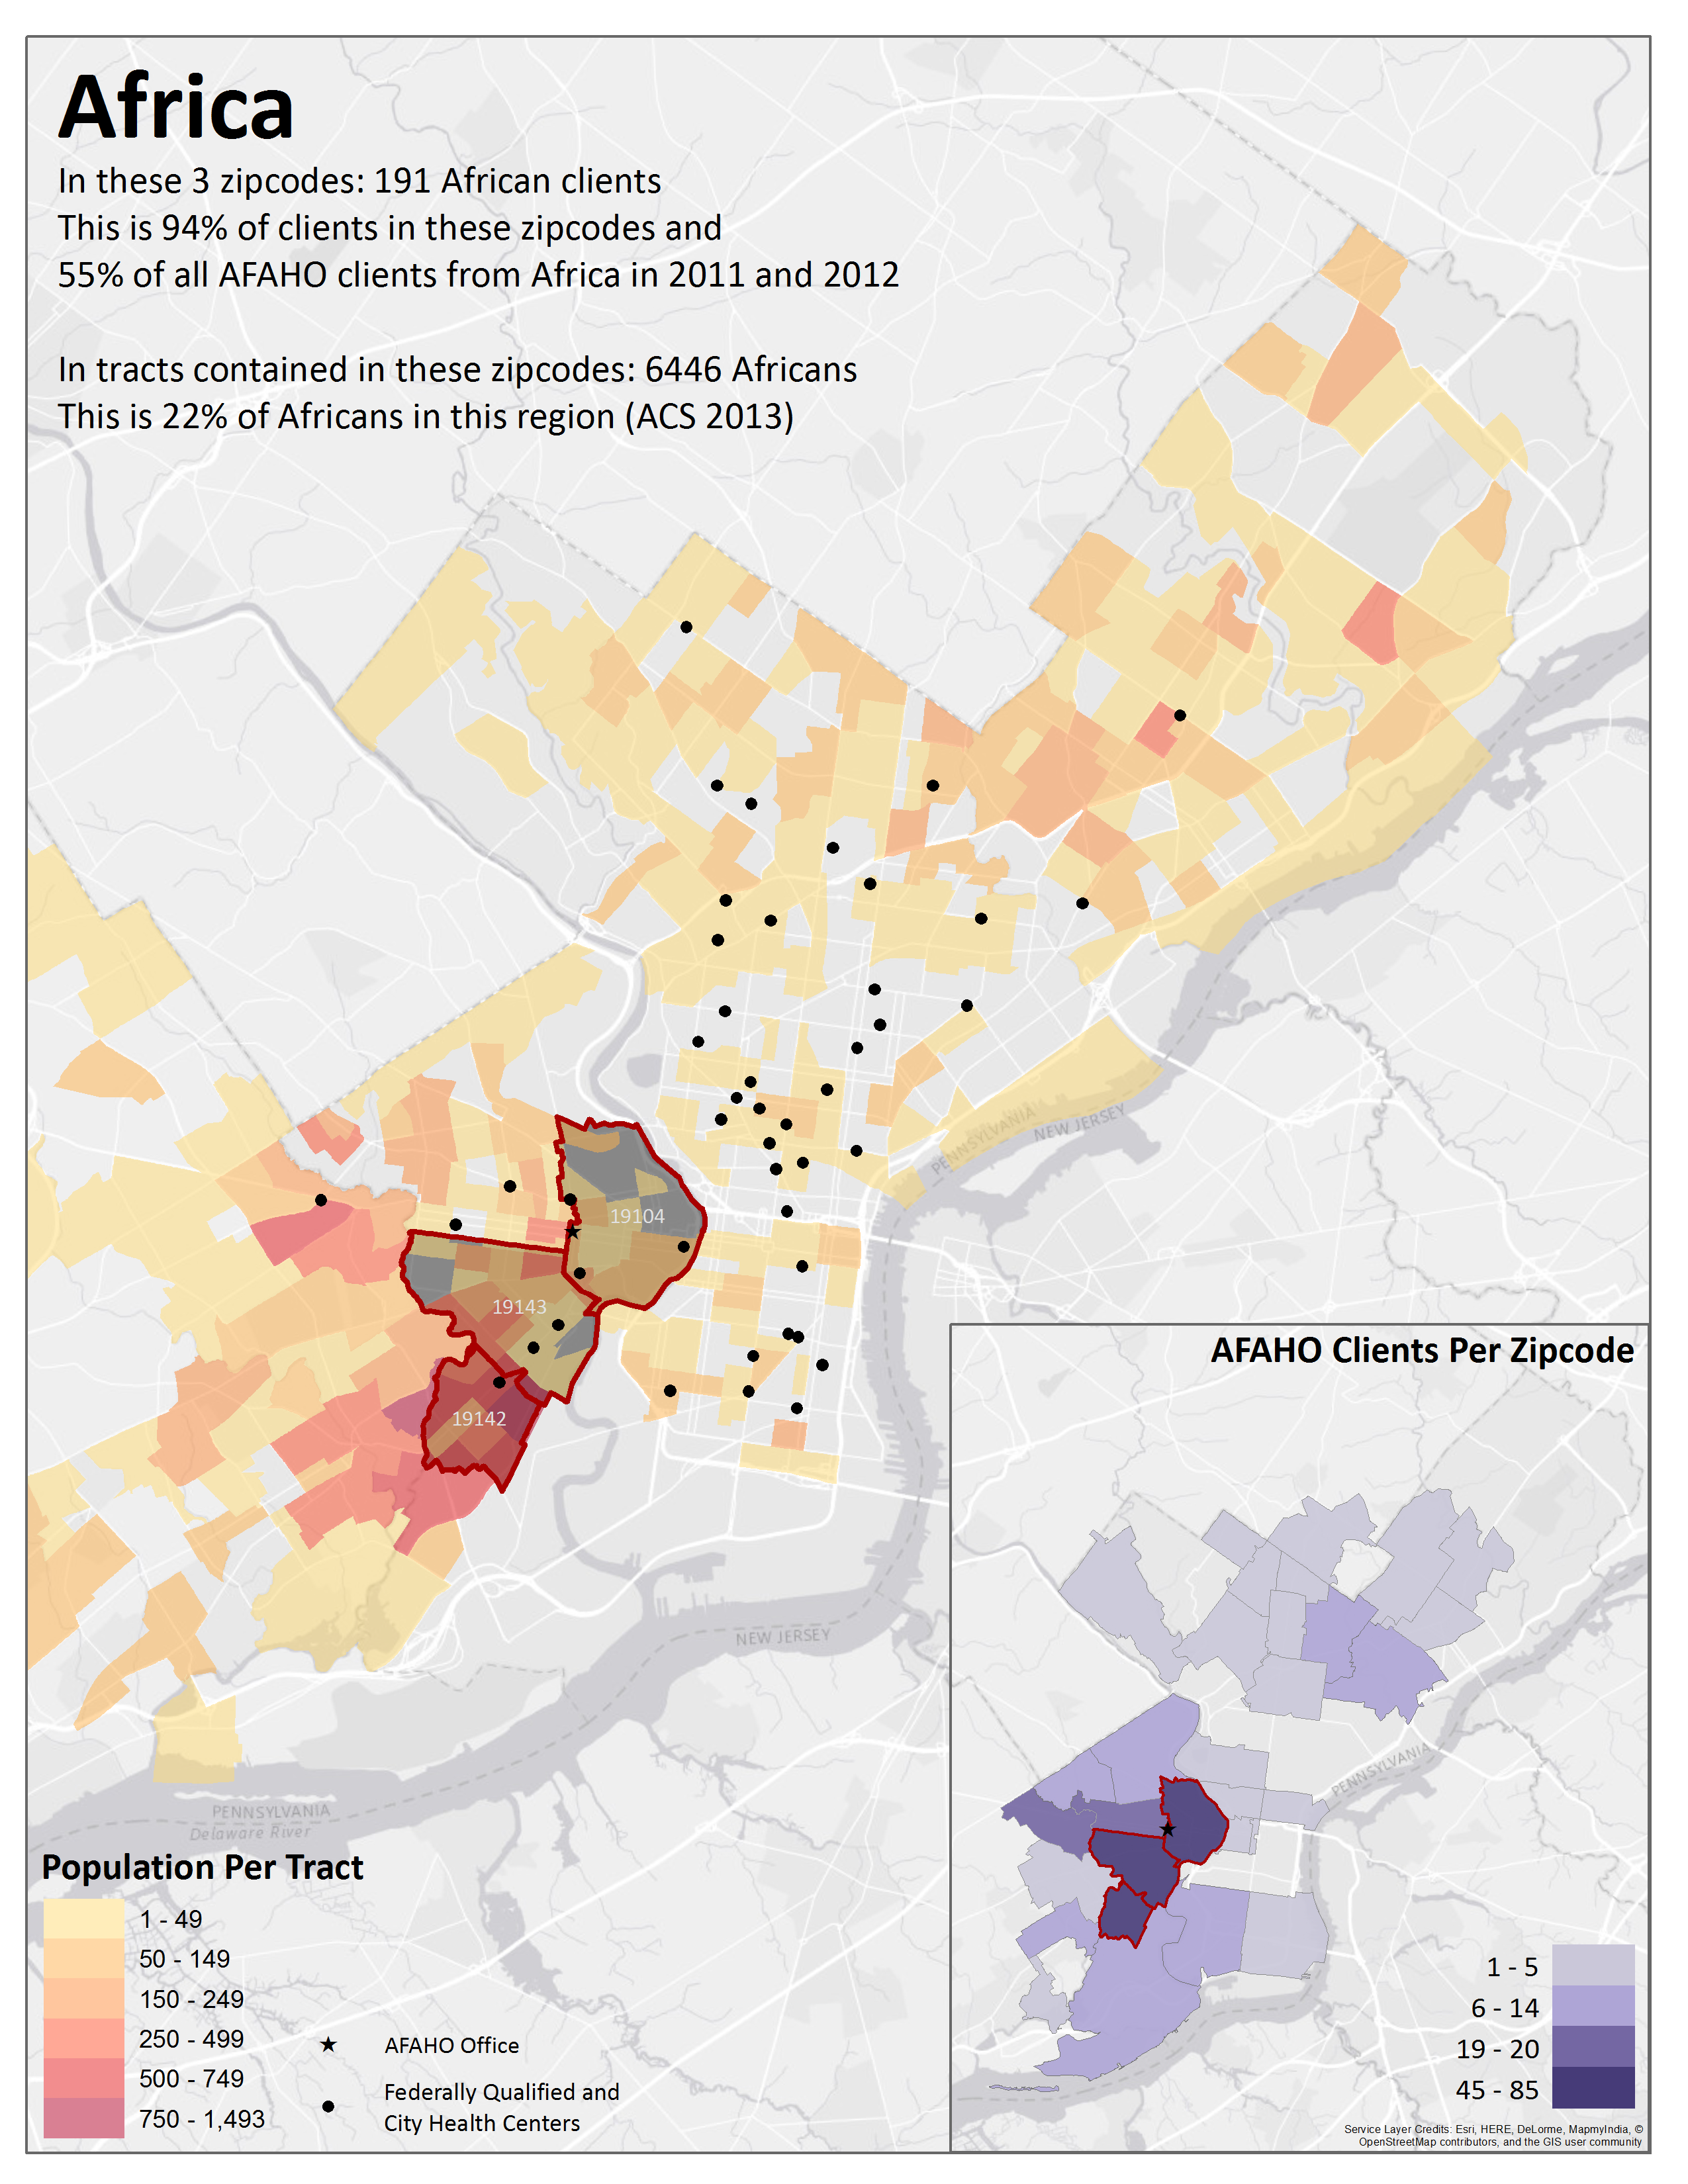
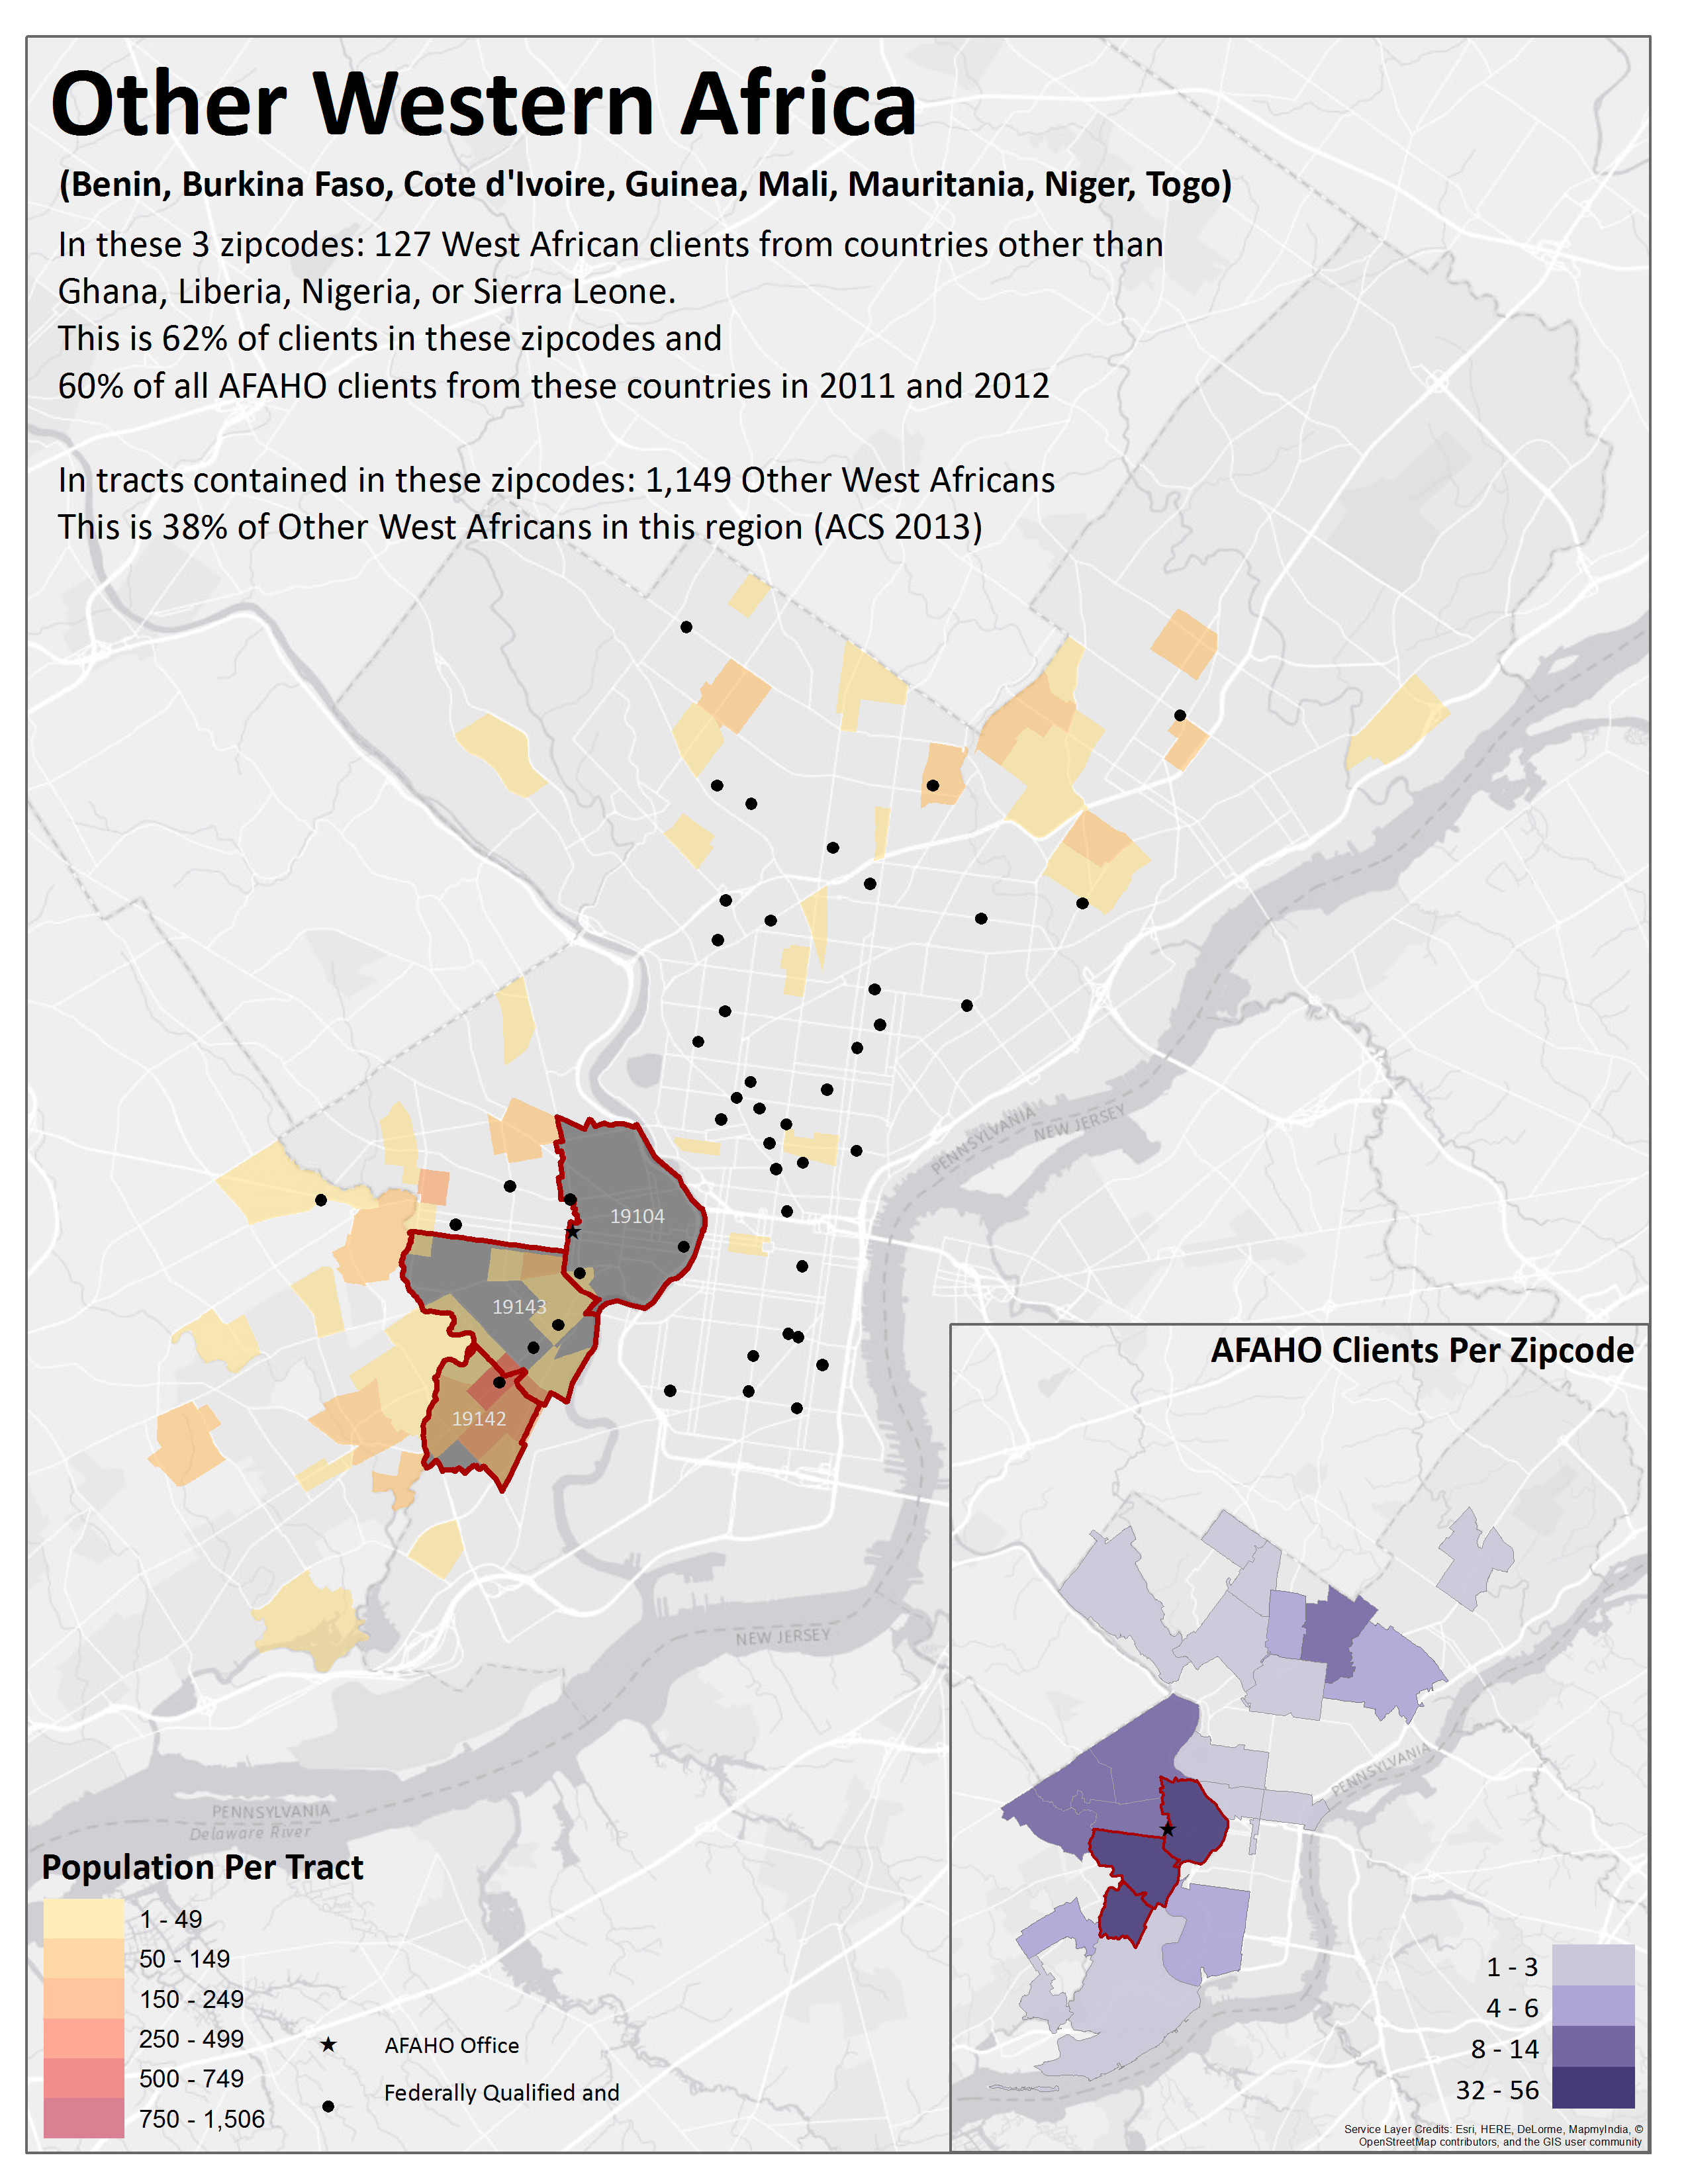
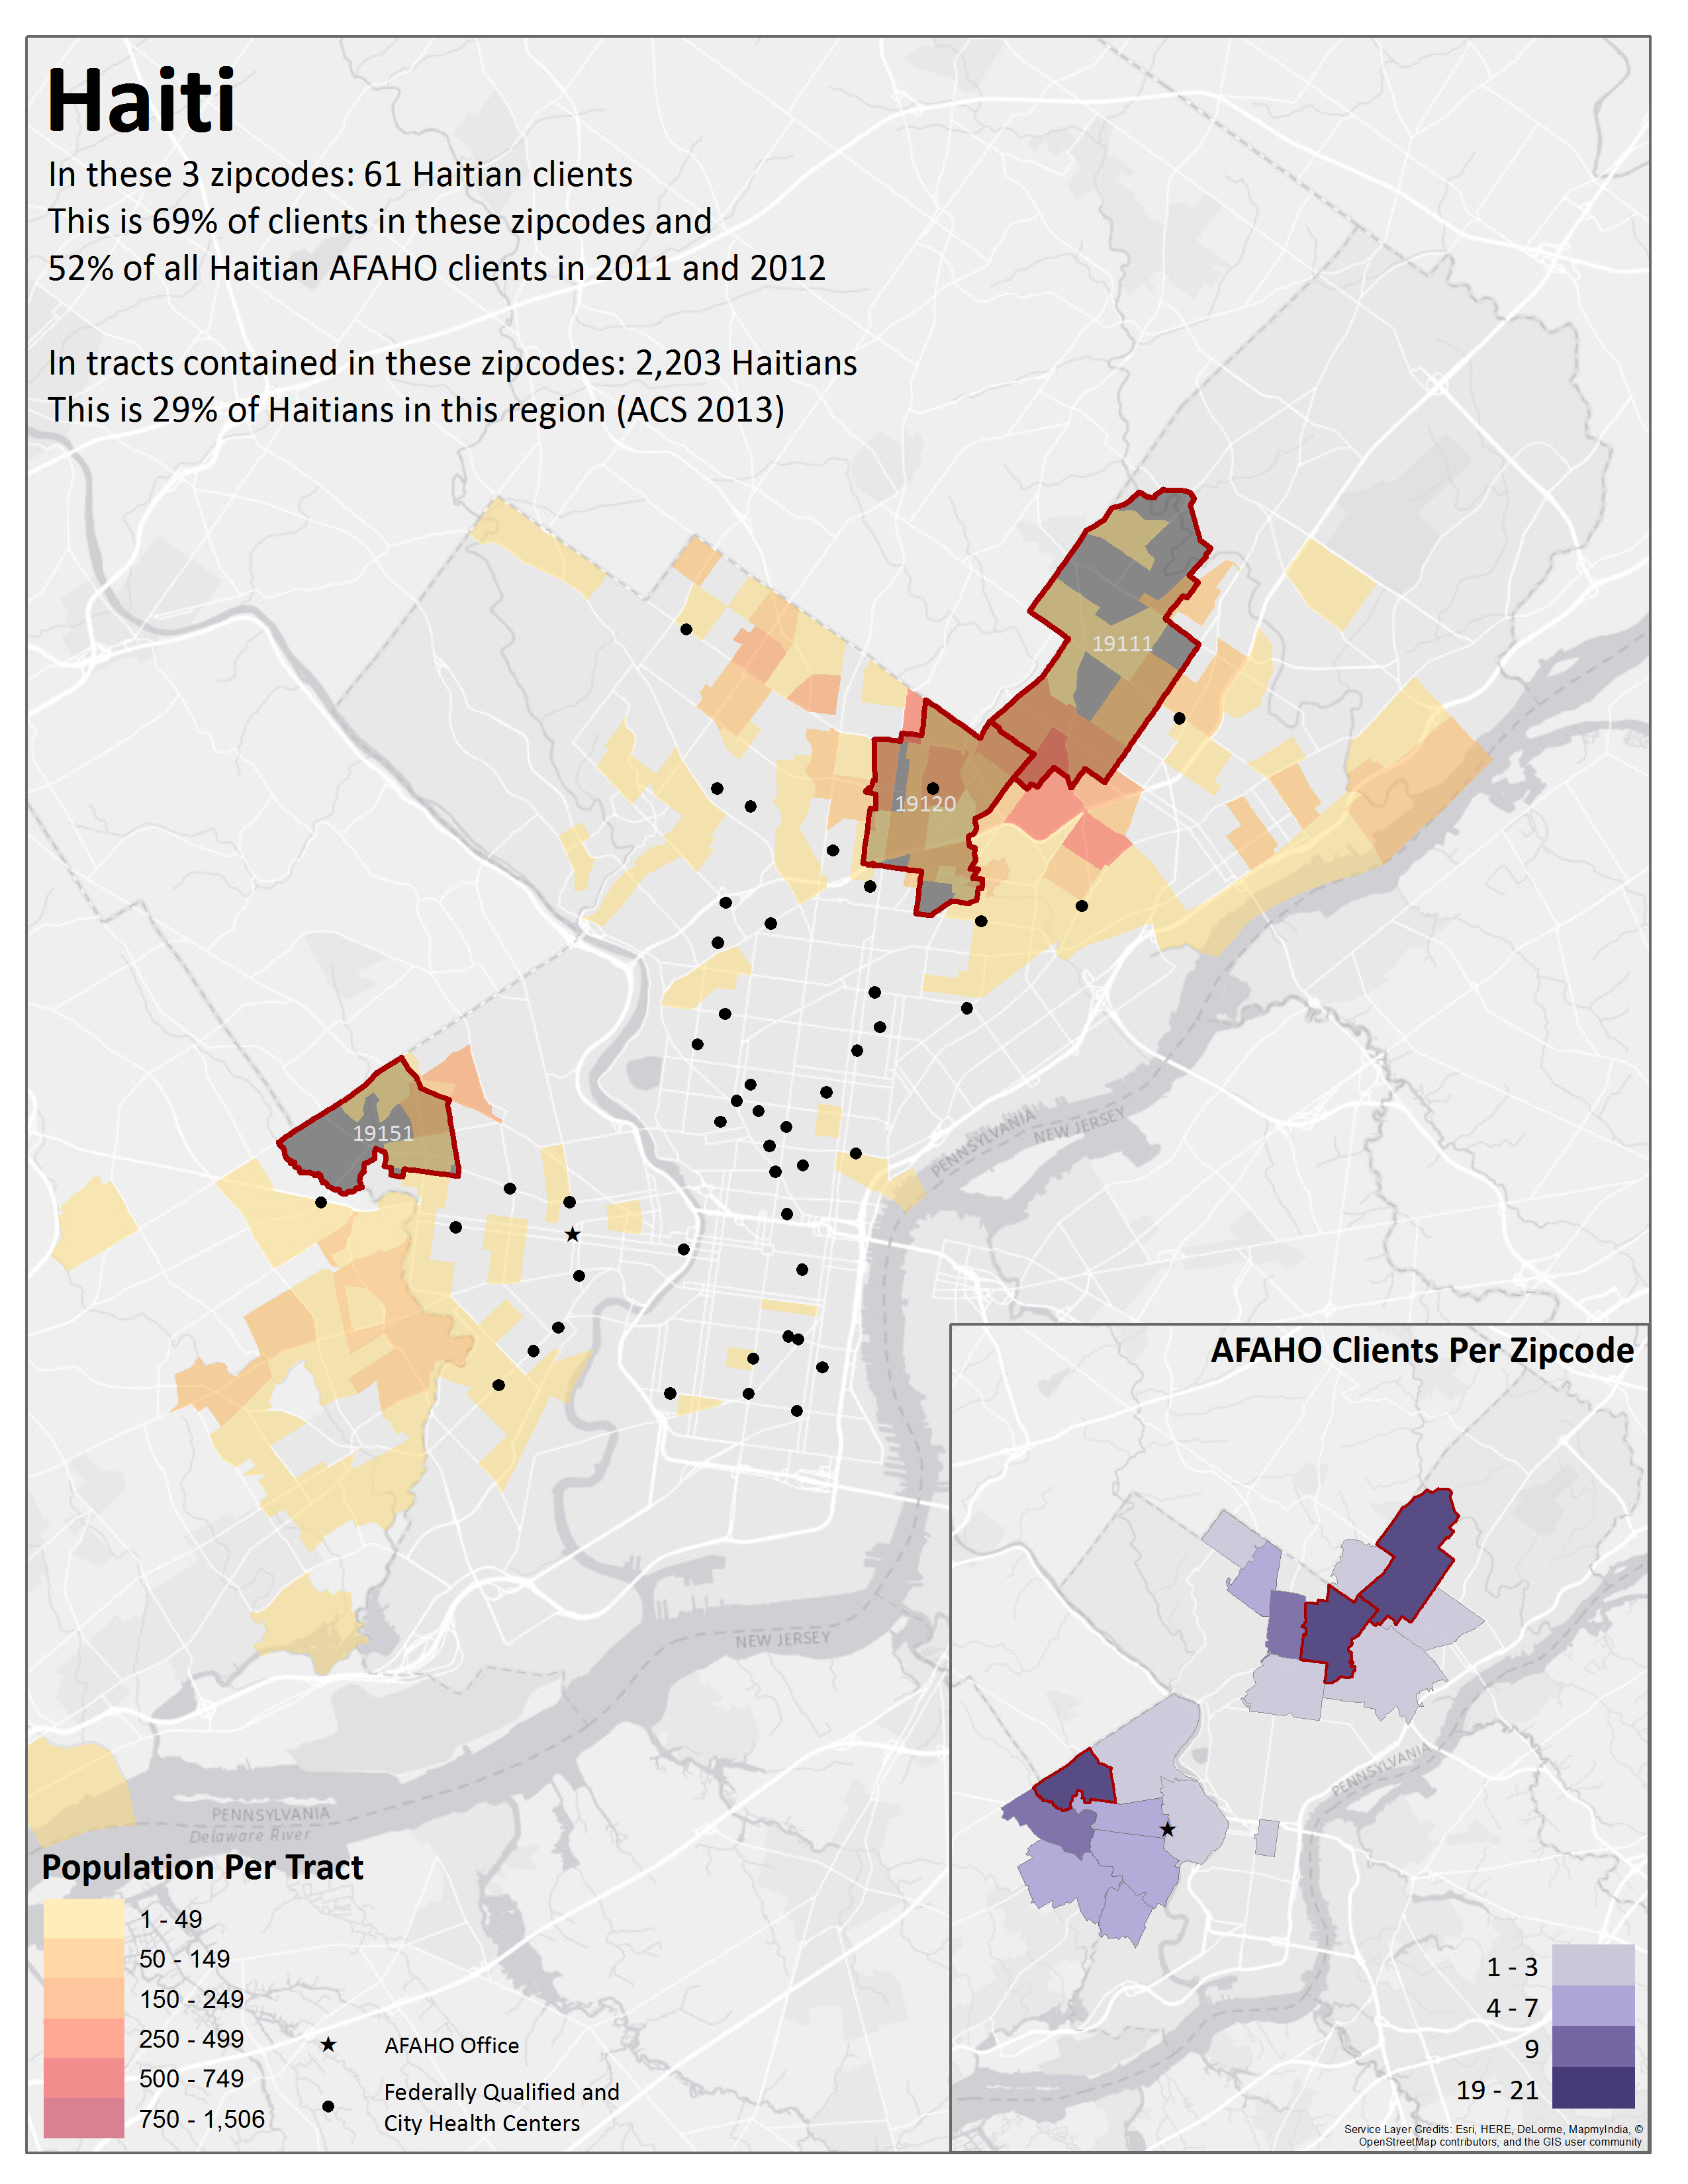
Health Clinic Client Distribution
Part of a series of maps showing the number of African Family Health Organization clients relative to Census-reported populations. This work was completed through the Summer of Maps program at Azavea. Read more about the project here.
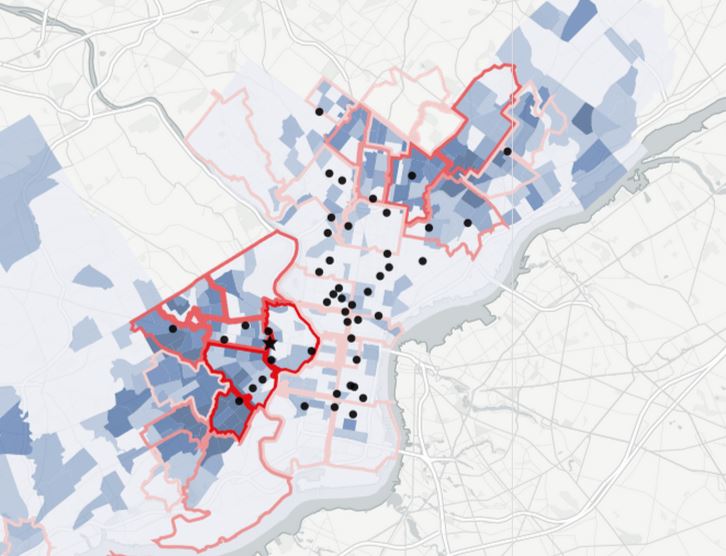
Health Clinic Client Distribution Interactive Map
A Carto map of the African and Haitian population in Philadelphia, the African Family Health Organization’s clients, and city health centers. This work was completed through the Summer of Maps program at Azavea. Read more about the project here
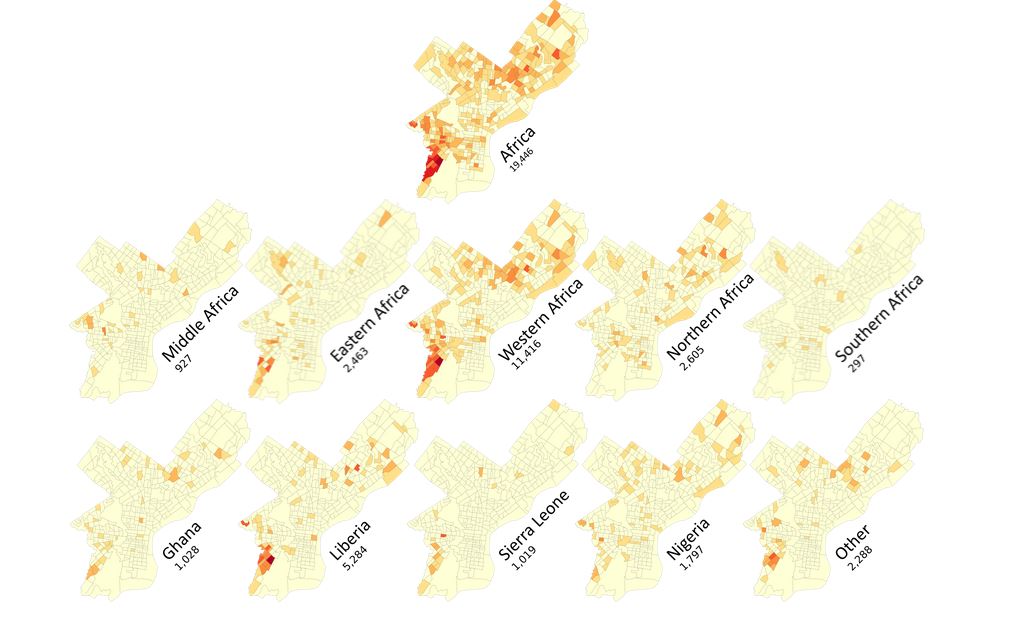
D3 Map Tree
A D3 tree in which the nodes have been replaced by images to create a tool for exploring maps of Philadelphia’s African-born population.
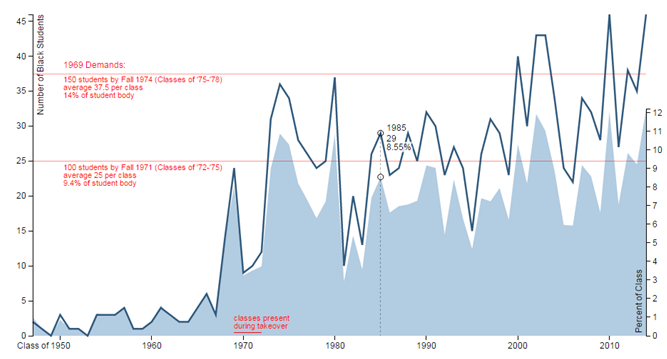
D3 Time Series
A D3 graph of Black student enrollment for the Swarthmore College Black Liberation 1969 Archive.
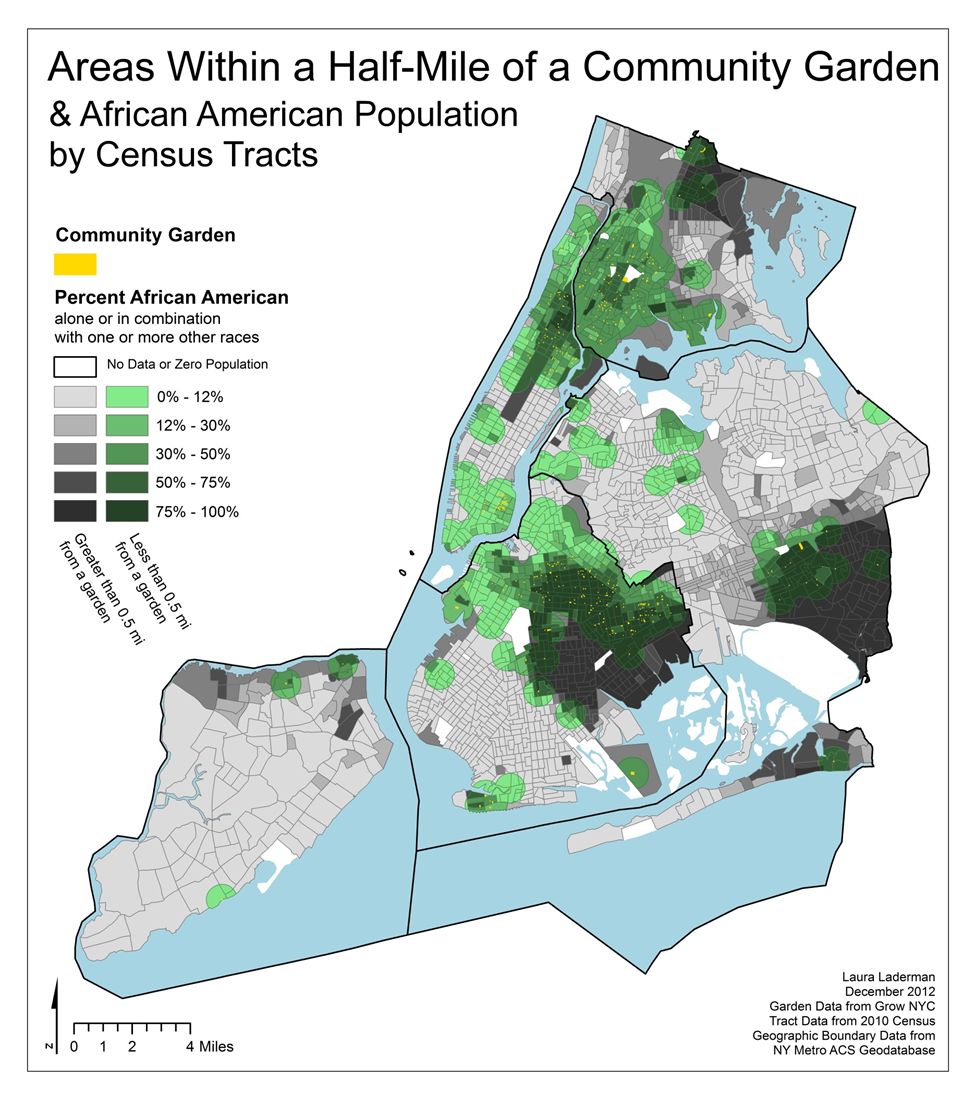
NYC Community Garden Access
A GIS final project measuring access to community gardens in New York City.
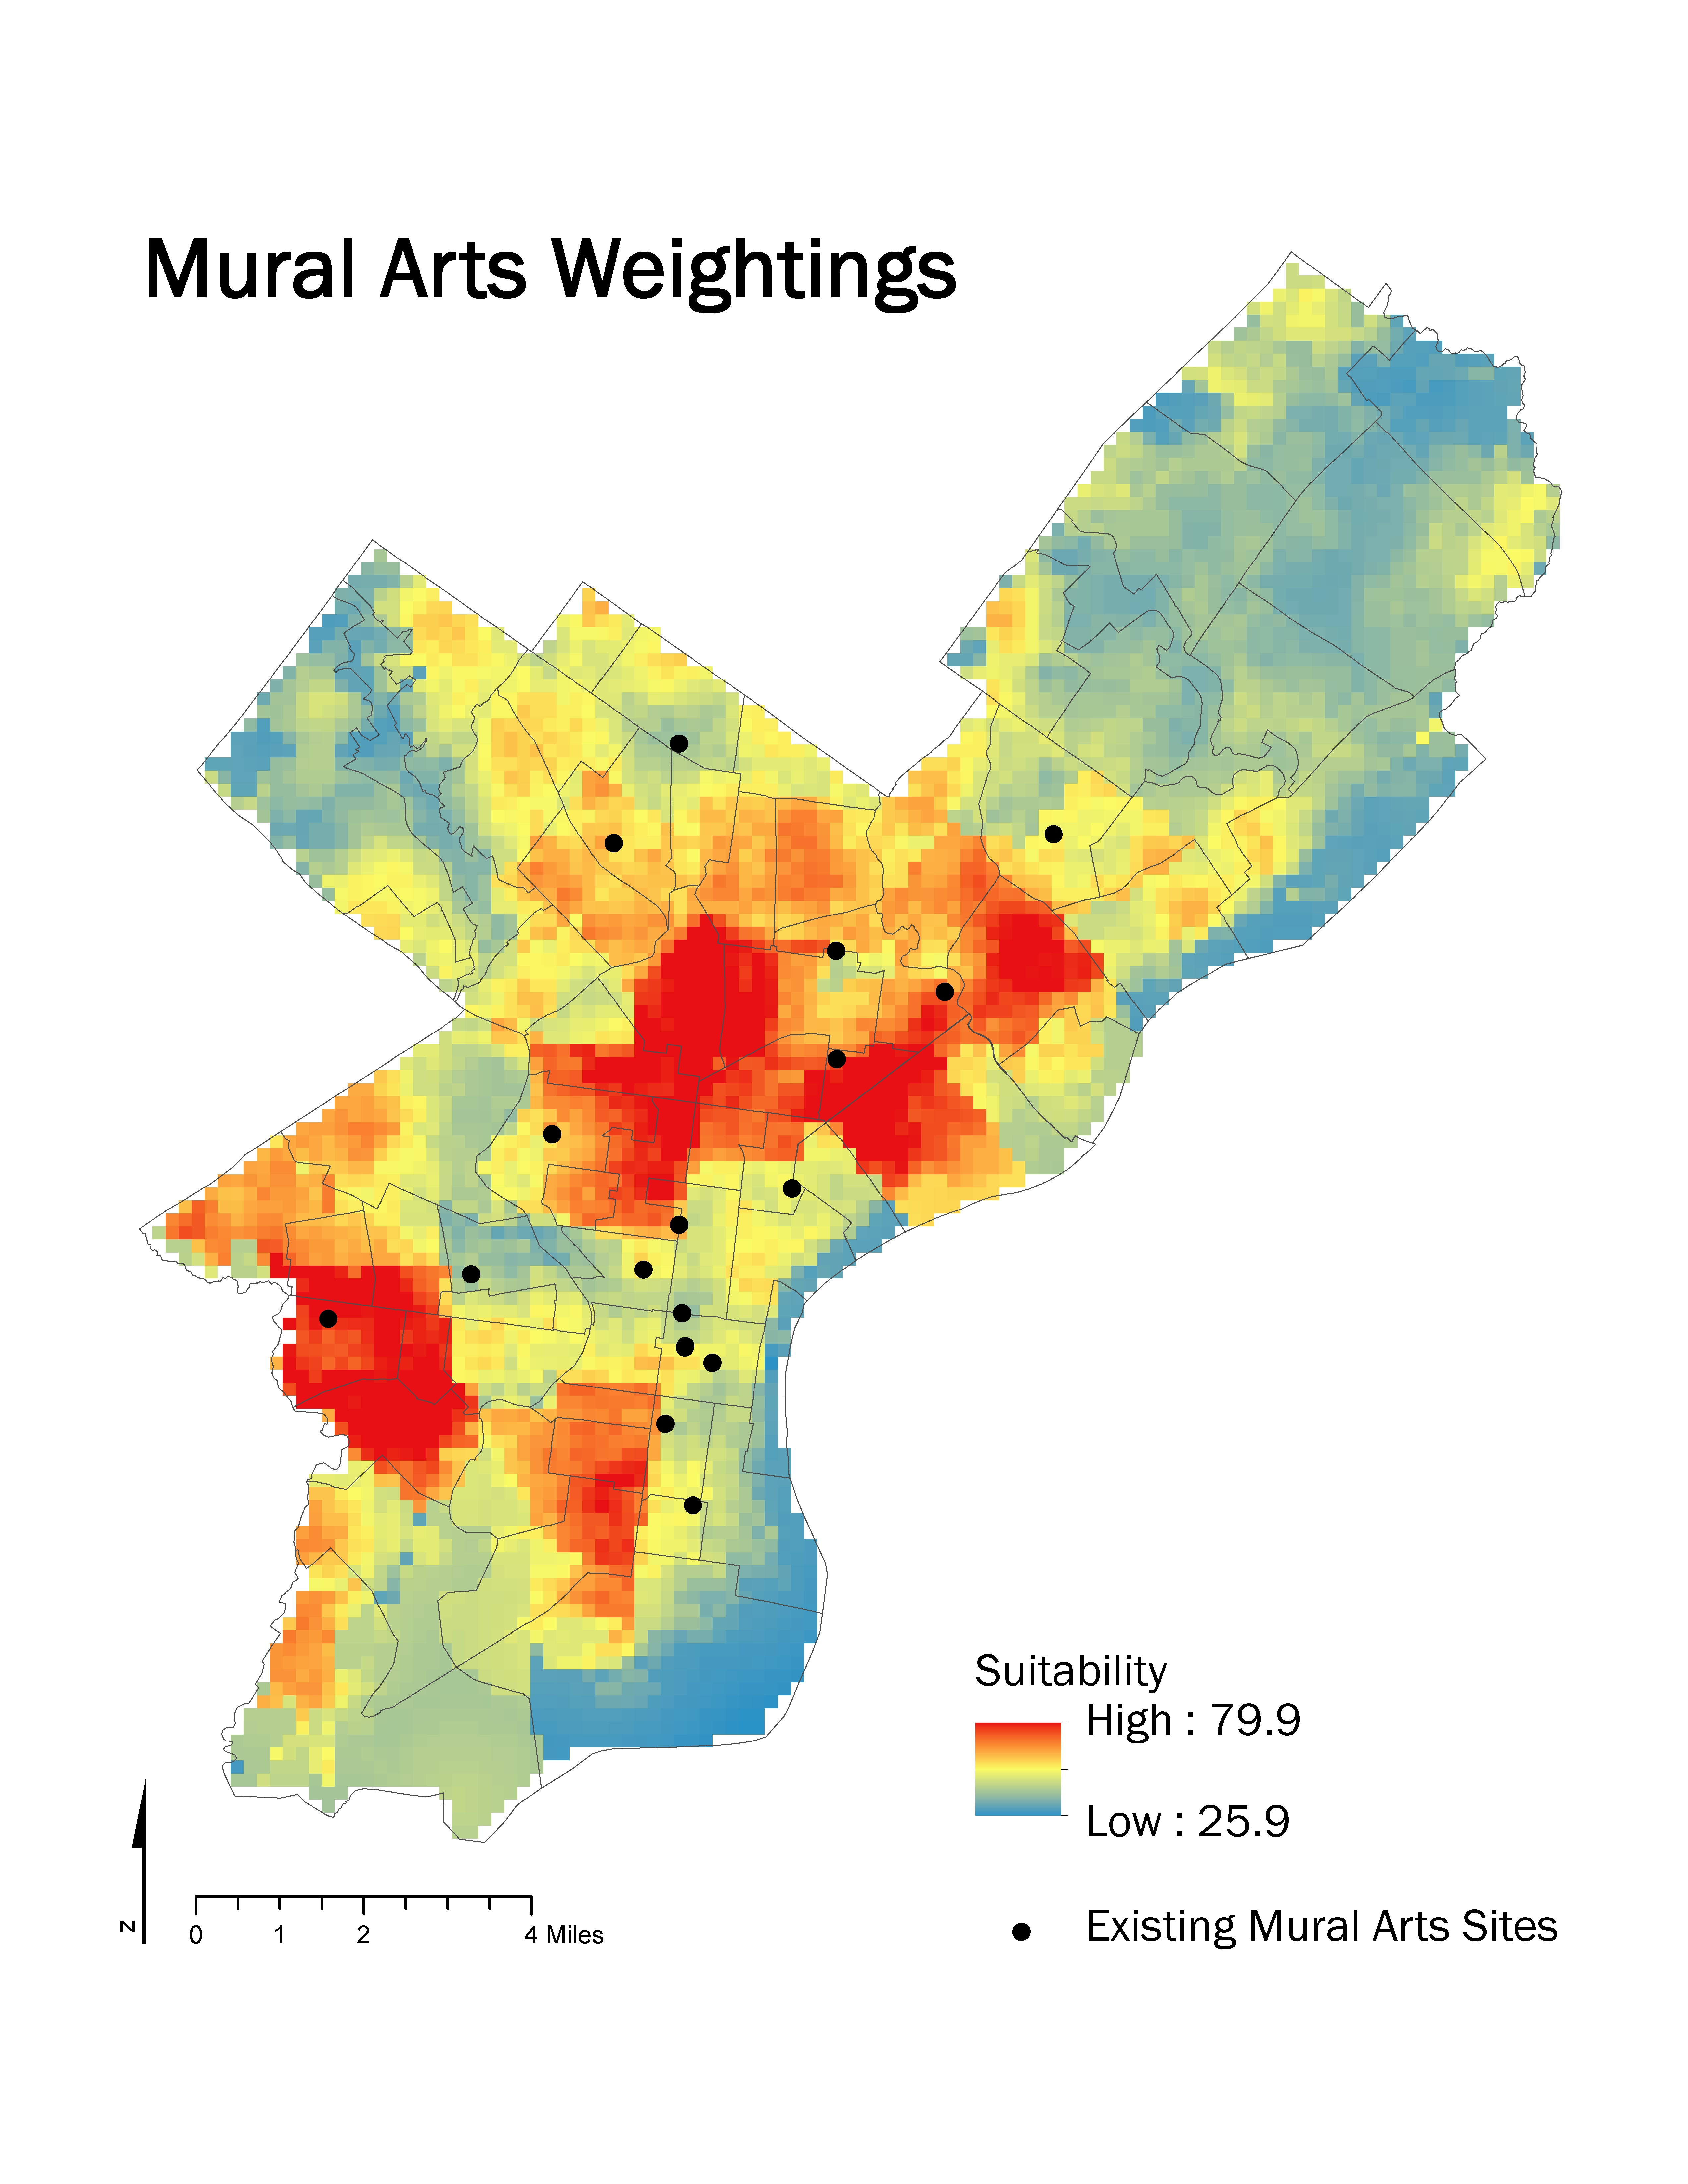
Site Prioritization Study
A semester-long client project for the Mural Arts Program in Philadelphia, performed collaboratively by everyone in the class.
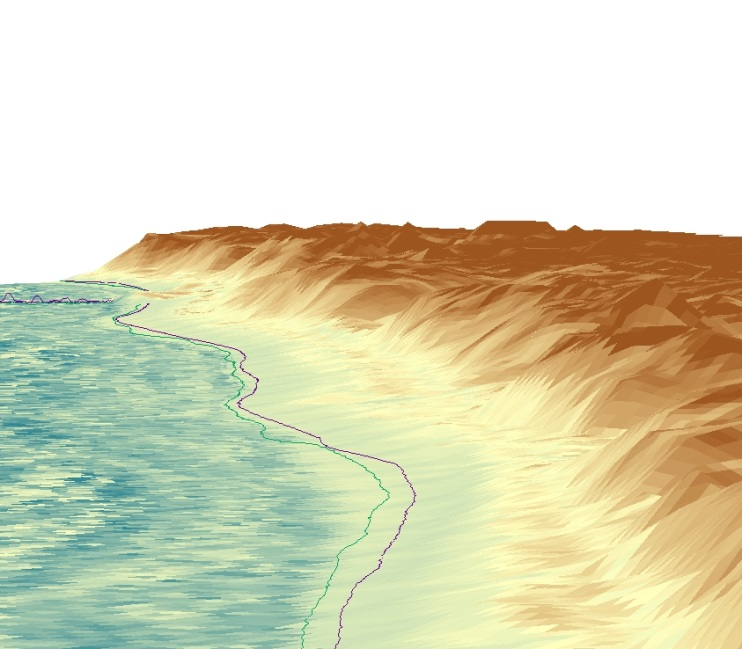
3D Visualization of LIDAR Data
A GIS final project on coastal geomorphology.
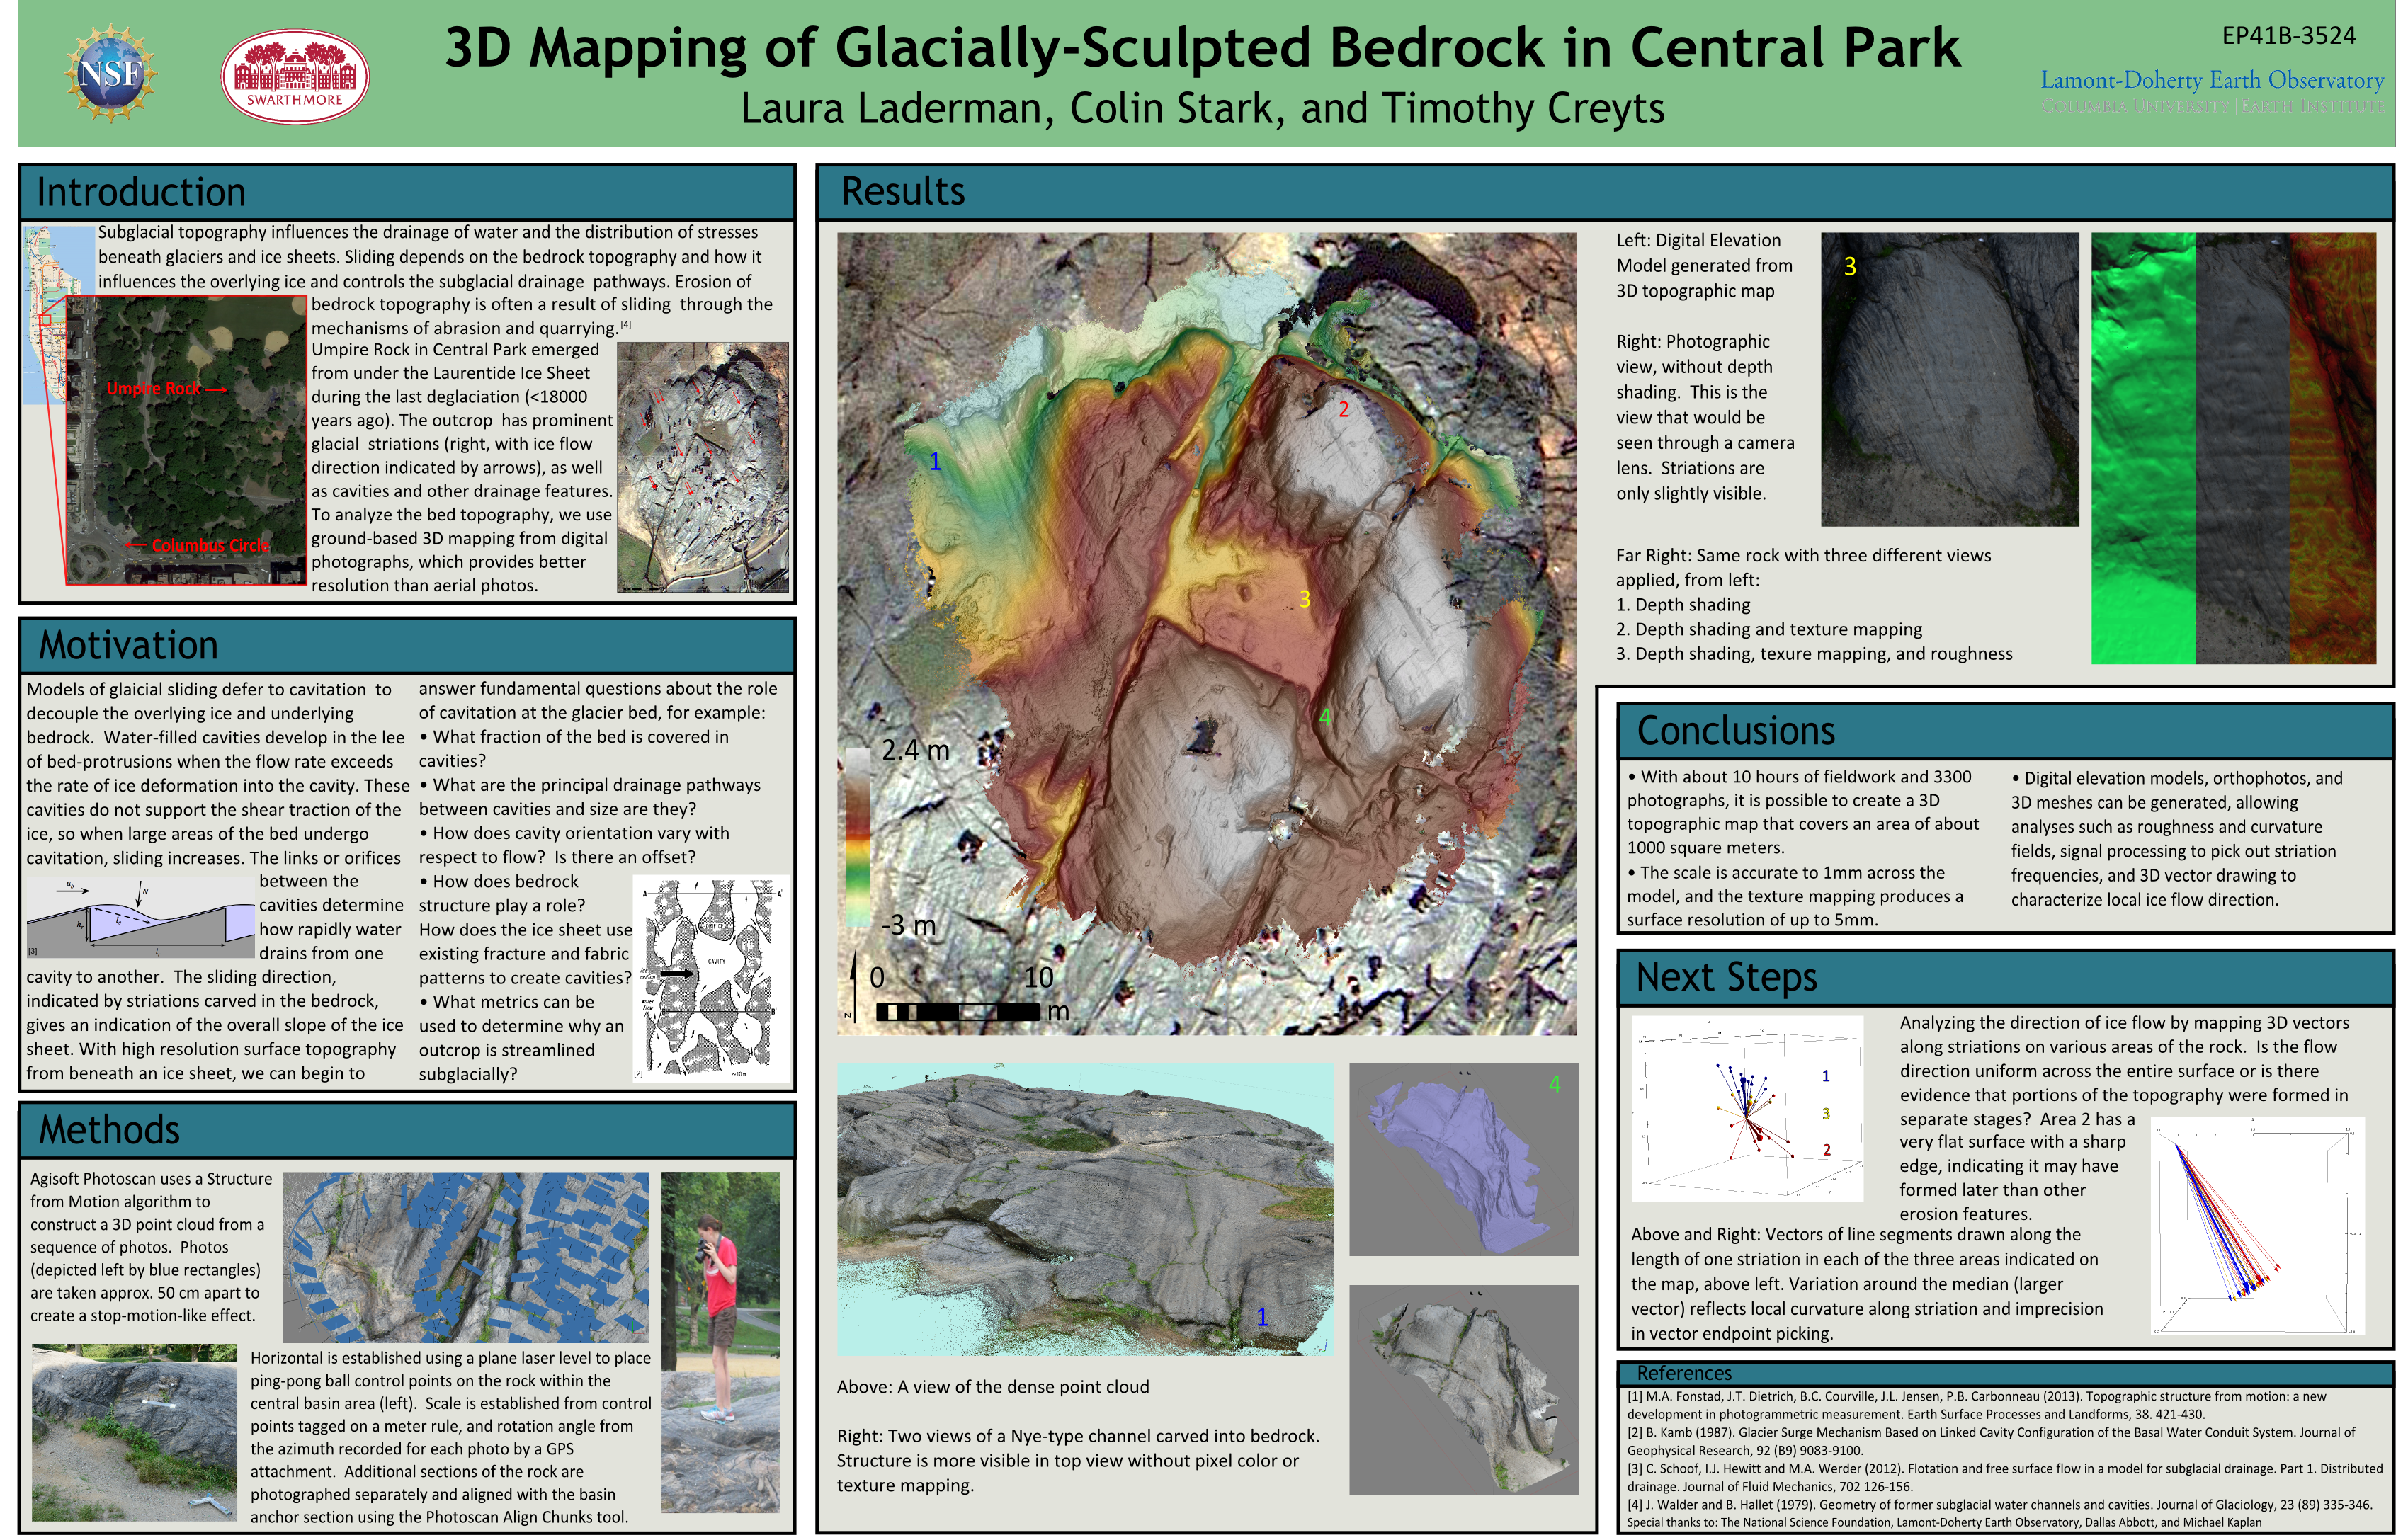
3D Mapping from Photographs
An NSF summer research project at Columbia University’s Lamont Doherty Earth Observatory on glacial bedrock geomorphology.